


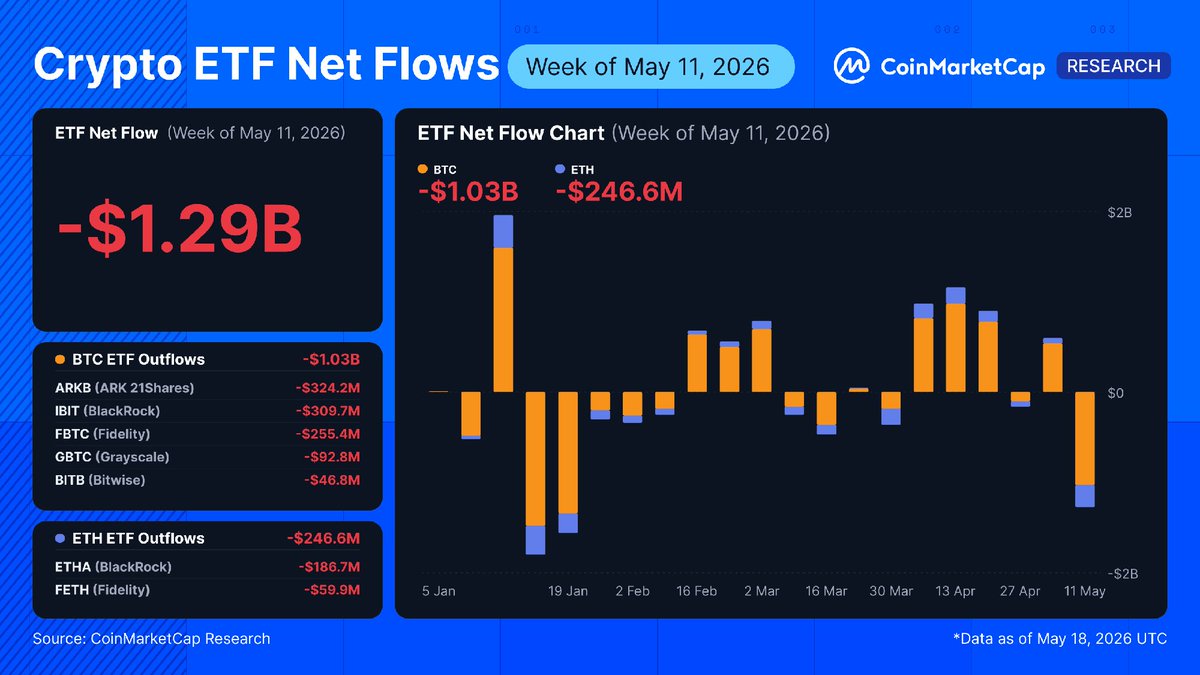
BTC & ETH ETFs Bleed $1.29B: 3rd-Worst Week YTD
🔴 11 May (Mon–Fri): BTC -$1.03B / ETH -$263.0M
> BTC -5.26% ($81,728 → $77,429)
> ETH -9.05% ($2,339 → $2,128)
Flashback: Late-Jan Was Worse
🔴 26 Jan: BTC -$1.5B / ETH -$327.1M (YTD #1)
> BTC -12.79% ($88,267 → $76,974)
> ETH -22.50% ($2,926 → $2,268)
🔴 19 Jan: BTC -$1.2B / ETH -$600.7M (YTD #2)
> BTC -6.46% ($92,554 → $86,572)
> ETH -11.63% ($3,187 → $2,816)
Two things stood out:
First, the BTC selling looks broader this time. ARKB and IBIT were nearly tied at the top, each seeing roughly $310M–$324M in outflows, while January’s waves were more IBIT-driven. ETH still rhymes with January, with ETHA doing most of the damage.
Second, BTC is now at $77k, less than 2% above the ~$76k support, making this week's ETF prints critical to watch.
From X
Disclaimer: The above content reflects only the author's opinion and does not represent any stance of CoinNX, nor does it constitute any investment advice related to CoinNX.