

#SP500:
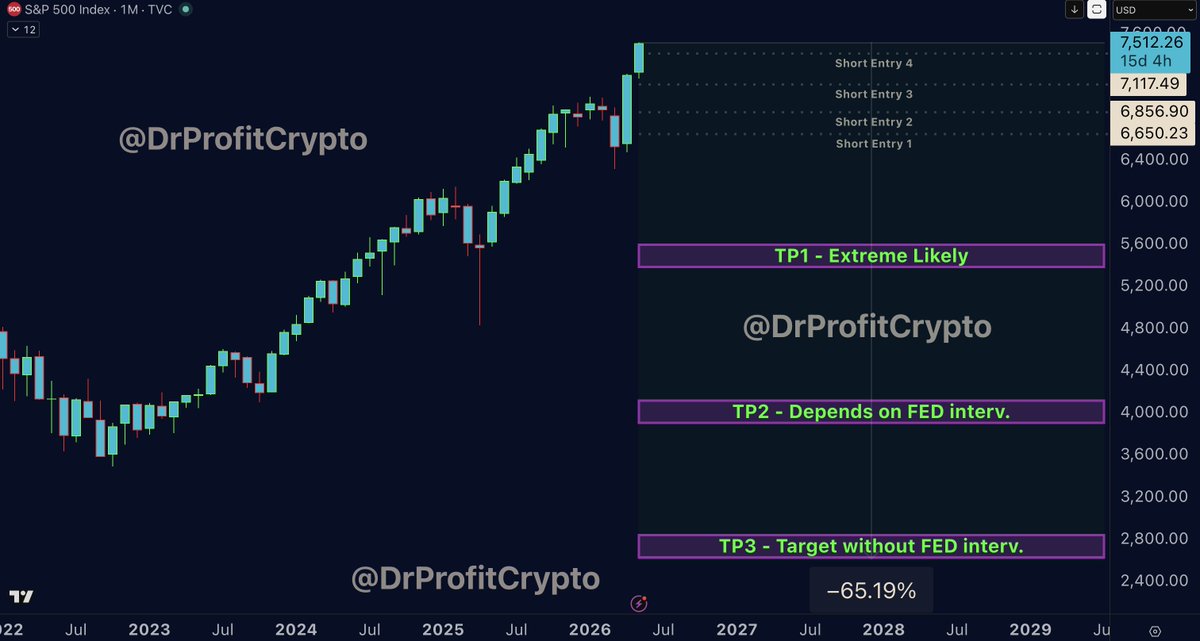
The Yield chaos is starting exactly as I called it in September 2025, when I said it would begin May–June 2026. Weeks ago, I finished accumulating my SP500 short at an average entry of 7000, everything is ready now. The market will do the rest!


#Bitcoin – What’s Next?
The Big Sunday Report: All We Need to Know
🚩 TA / LCA / Psychological Breakdown:
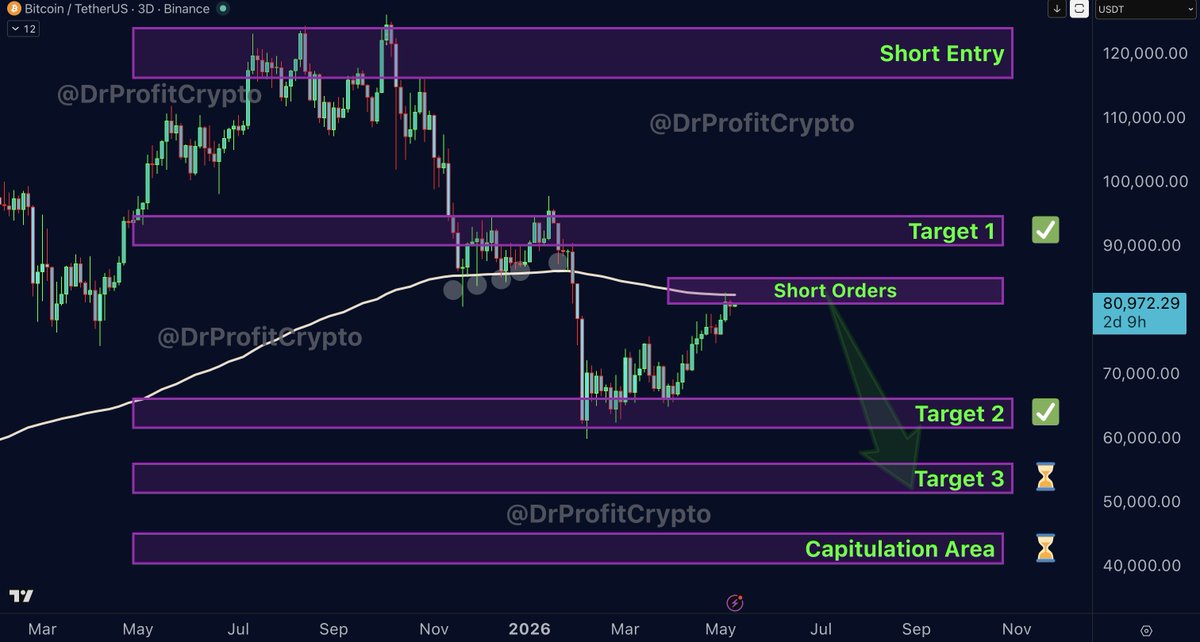
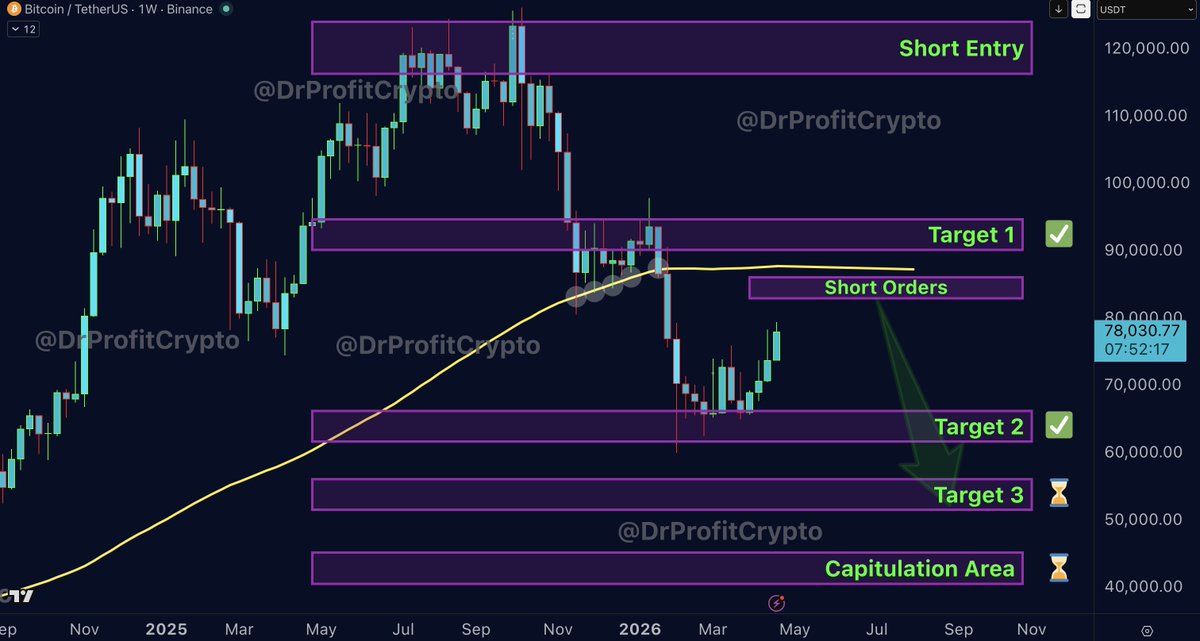
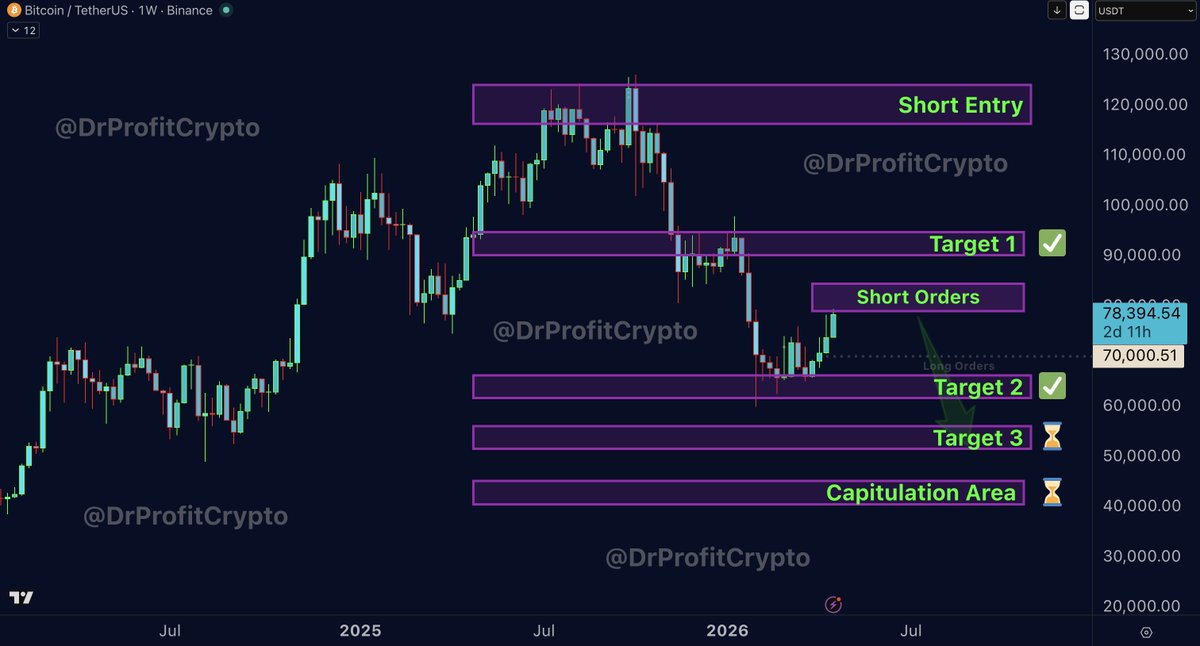
These are the last days and if you are lucky the last few weeks above the 80k range, the area of 50k and below is calling and the big crash is a matter of time, the trap is in its final stages and all my predictions regarding this trap proved to be more than accurate, now its time for my final prediction regarding this trap and its the region of 80-85k and why its the local top! The mother of all strategies that helped me with shorting the 120k top in 2025 is something what i repeat right now. I'm doing the same thing I did back in 2025 when I shorted the top at 115-125k. Back then I added shorts every day for 10 days straight while price stayed in that zone. Same plan now, just a different zone which is: 82-85k. As long as Bitcoin is in this area, I'm shorting every day with 10% of my money. So for example, if I have 10k, I short 1k each day between 82-85k. Doesn't matter where exactly the price is in that range, if it's in the zone, I short. For the longs I took at 71k, I'm taking profit every day, 10% of the position at a time, over the next 10 days in the same region between 82-85k. The moment a new short is opened, I take profits from the 71k long, the 60k spot purchase, and the 75k long. I am starting to accumulate shorts at the local top region, looking forward to play out in the coming days/weeks.
The bullish trap I announced in February, which will top out in May-June, is following my timeline with perfect accuracy. Most people forget my words from February, when I said 79-85k is the region Bitcoin is heading to next and that this will most likely happen in May-June. I gave the exact plan on what to do, and I want to thank everyone who has been DMing me about these profitable trades, we are now near the region we have been waiting for! I am convinced that the next days and weeks will become crazy in terms of bullish sentiment. People will start calling for the next round of the bull market, and this has slightly started already. I can see a lot of low IQ content on X, many altcoin calls, and accounts shouting for 100k or more right now. The fear is gone, retail has been piling back in since 76k at a very strong pace, and soon they will realize it was a big mistake. I also saw some accounts that shorted Bitcoin way too early in the 70s region, that was a big mistake too, as it was clear the 8x,000 would come first, and here we are. It feels very close, and only the neutral observer is able to see this.
The crash is very close and we are witnessing the final days of this relief pump which is indeed a fake pump and a beautiful trap, to trap as many retails as possible before the next downside move is coming. Very important days in Premium, we prepare for the coming months again. Important details and entries shared only in the membership. Also Bitcoin short regions and bottom formation buy orders will be shared in the coming weeks once the big downside happens. Join here: https://t.co/Ice9n2tMya
Today was the biggest robbery I have ever seen since a very long time. The @UEFA is a disgusting criminal organization and the entire match needs a full investigation
Why the Stock Market Is Going to Crash:
Part 1: What the 1973 Oil Crisis Teaches Us:
The Big Sunday Report: Back in 1973, about 5–7% of the world's oil demand was cut off for roughly 5 months, and the consequences led to the worst crash in history since the Great Depression! Today, around 20% of the WORLD'S OIL DEMAND has been affected for 2 months, and there's no end in sight. This means the situation today is even worse than it was during the 1973 oil crisis, and yet most don't understand the pattern! This brings me to the question of how the $SPX (SP500) behaved then, and we need to compare it with now. In 1973, the #SPX crashed 20% as in October 1973 the Oil Embargo was announced. During that time, the S&P 500 was 7% away from its ATH, recovering from an earlier 17% correction, and the market was in strong euphoria believing in the next rally. Investors thought the worst was over, and out of the sudden the embargo hit the market and we saw a sharp drop of 20% that followed in October 1973. The same we saw in March 2026, the Strait of Hormuz was closed and the S&P 500 reacted with a 10% downside move. This is what I call the first shockwave, but what if I tell you that the real, and much worse downside move happened after the announcement of the end of the oil embargo was made ?
The oil embargo officially ended on March 17, 1974. This is when the real crash began, and the S&P 500 crashed 40% within the next 6 months! This was the worst crash since the Great Depression, and only 2008 was worse. The crash didn't happen during the embargo. It happened after the embargo was lifted, when everyone assumed things were going back to normal. The damage to the economy, the inflation, the higher input costs, the broken consumer, had already been done, and the market understood the damage and we see it today as well, as the parallel today is direct. The S&P 500 is making new highs while an oil supply shock is unfolding. Investors are doing exactly what they did in 1973: assuming the issue will resolve and pricing in a soft landing. But once the economic damage becomes visible in earnings and consumer spending, the same delayed reaction is likely to play out, and this is exactly what was addressed by Jerome Powell in the most recent FOMC meeting! Inflation is rising again, the FED can't ease anymore!
Part 2: The Private Credit and Banking Risk:
There's a type of investment fund called a private credit fund. These funds lend money to large companies, working a lot like hedge funds. The problem is that they borrow huge amounts of money themselves to make bigger loans and bigger profits. This is called leverage, and it's a double edged sword. When things go well, profits are programmed, but when things go badly, losses are programmed too.
The situation right now is alarming. Investors are pulling their money out at a record pace, with over $7 billion withdrawn from major private credit funds in late 2025. BlackRock has even blocked some investors from withdrawing money. Loan defaults are at record highs as well, with 5.8% of private credit loans in default as of January 2026, the highest level ever recorded! About 40% of the companies that borrowed from these funds are now burning more cash than they earn, and the stock market is starting to notice, with shares of big private equity and credit firms falling sharply. If these funds collapse, banks go down with them, because banks lent them much of the money in the first place. So what happens if banks fail? Since the 2010 Dodd-Frank Act in the U.S. and the 2014 EU bank rescue rules, governments are no longer supposed to bail out failing banks with taxpayer money. Instead, they use something called a bail-in. They take money from depositors and bondholders and turn it into bank shares. The result is that bank stocks crash and ordinary people lose part of their savings. This is why physical gold and silver are the only real safe haven. I consider owning them a MUST.
The Main Warning Signs
The first and most important is oil. In 1973, oil first moved up, and the stock market crash came after the Arab nations reopened oil supply. The damage was already done. What we're seeing now in the S&P 500 looks like the final push higher before the expected crash. History is repeating itself. The second is the yield curve inversion. This happens when short-term interest rates rise above long-term rates, which is a clear warning sign. It has come before every U.S. recession in the past 50+ years, usually 12 to 24 months in advance. Back in 2025, I wrote a full report pointing to June 2026 as the likely crash zone, and the report was written in September 2025 and can be found here: https://t.co/zmp7L8Yi8c
The third is insider selling at record speed. Company executives and big shareholders have been dumping their own stock at a pace never seen before, especially since August–September 2025. When insiders are selling this aggressively, it tells you everything you need to know and thats something I observe since many months!
The fourth is extreme risk appetite, and right now it's at its highest point since 2021. In simple words, risk appetite means how much investors are willing to bet on risky things like stocks instead of keeping their money safe. Right now, investors are throwing money into risky assets like never before. According to EPFR fund flow data, risky assets have seen record net inflows exceeding safe assets by 220bn over the last 4 weeks, the strongest since the 2021 meme-stock peak. To put it simply, people are pouring much more money into stocks than into safe places, and the gap is the biggest we've seen in years. This also aligns with updates to S&P Global's Investment Manager Index risk appetite gauge and Goldman's proprietary RAI, both hitting multi-year highs. This is the same type of euphoria we saw right before the 2021 top, and history shows that when everyone is greedy and chasing the market at the same time, the top is usually very close and this is the moment when risk appetite is this extreme, it's a clear warning sign, and trust me, you dont want to be among the losers who bought the top!
The 1929 Parallel: Why You Need to Study the Great Depression
Study the Great Depression of 1929, and I can't repeat it often enough. Study it, you need to study 1929! You will notice many similarities. The people who owned physical gold and silver back then were the big winners. Land was sold for even one penny because there was no liquidity at all. Farmers had tons of wheat but there was no one able to buy it. The US President Herbert Hoover famously said right before the great depression, "Prosperity is just around the corner," talking about the stock market and its bullish movements and claiming that nothing could stop the upside move. Everyone in the US was invested in stocks back then, the same as today, as record amounts of retail investors are sitting on stocks currently, the highest amount of retails ever recorded. Now, a hundred years later, we have another president talking about the stock market like no one else. Trump is talking about being tired of winning, or calling it the best economy ever based on the stock market, and ignoring the real economy that is suffering and has no liquidity to breathe currently. I see tons of similarities, and I am scared to even speak it out, but my biggest concern is a repeat of the Great Depression. I am not a doomsday caller, but I am here to remind you that physical gold and silver are more important than ever, no matter what the price says.
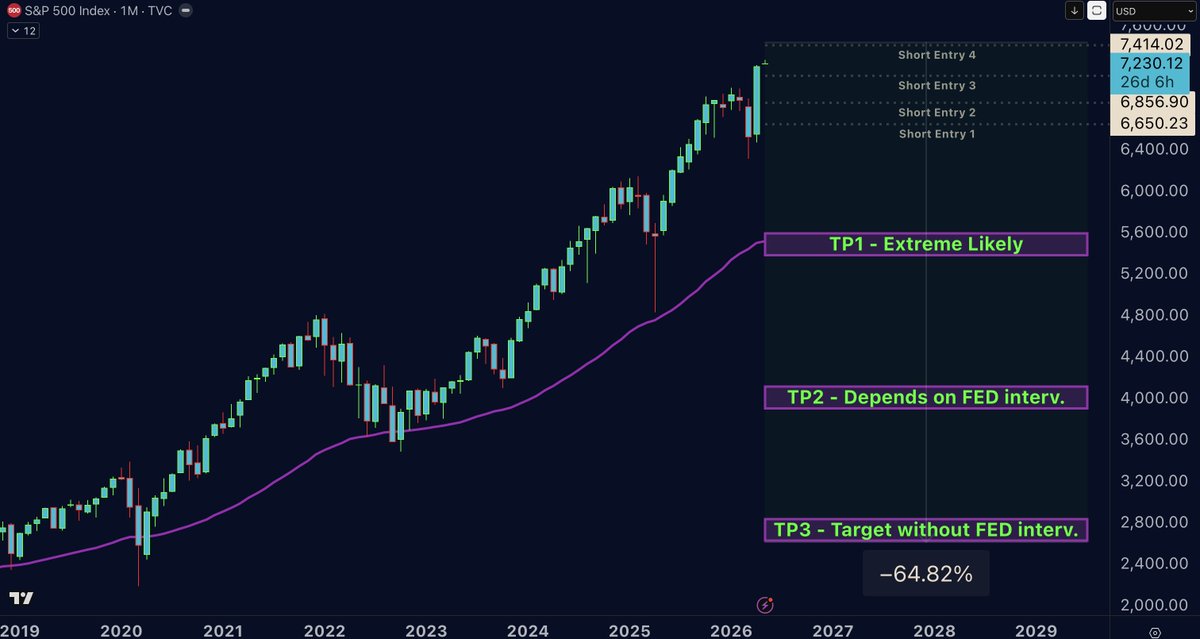
My Trade and My Targets
Let me be clear about where I stand. I am not just talking, I am positioned. I have shorted the S&P 500 at 6400, 6700, 6900, and 7100, and my final order remains open in the 7400 region if the market gives us that opportunity. In my view, we are deep inside top territory, and I am placing my shorts right here, right now, for every single reason laid out above. The signs are everywhere. Spotting the top is not the hard part, anyone paying attention can see it. The hard part is pinpointing the exact target on the way down, because that depends entirely on one thing: will the FED print again? And the answer that history teached us is simple. The FED only starts to print once a crisis hits, and now lets ask the same for 2008, where the FED wasnt able to print more money, and the Lehman crisis and the 2008 crash started and how likely is it in the current time ?
In 2008, the FED did not intervene to save Lehman Brothers. Everyone expected a rescue, everyone assumed the FED would step in like it did with Bear Stearns just months earlier. But the FED let Lehman fail, the bank went bankrupt, and the entire financial system nearly collapsed with it. That single decision changed everything. It triggered the worst financial crisis since the Great Depression, and it is the exact reason the bail-in laws I mentioned earlier even exist today. Dodd Frank in the US and the EU bank rescue rules were both born directly out of the chaos of 2008, designed so that taxpayers would never again foot the bill. Next time, depositors and bondholders pay, and this is where the real risk hits the ordinary person. In simple words, if your bank fails, the government will not save it with taxpayer money like in 2008. Instead, the bank takes a part of your savings, anything sitting in your account, and converts it into worthless bank shares of the failing bank. Your money is gone, replaced by stock in a bank that just collapsed. In the EU, deposits up to €100,000 are technically protected by deposit insurance, and in the U.S. up to $250,000 by the FDIC, but anything above that is fair game, and history has already shown us this is not theory. It happened in Cyprus in 2013, where depositors lost a huge chunk of their savings overnight, and this will let the fire of the crash expand.
So for my targets, I see three realistic scenarios, and they all depend on the FED:
Scenario 1: The FED panics and prints again. If inflation cools enough to give them room, they flood the system with liquidity, and the crash is contained to a sharp but limited drop. This is the most "comfortable" outcome for the market.
Scenario 2: The FED is trapped by inflation and cannot print. With inflation rising again, as Powell himself just confirmed, the FED may have its hands tied. No money printing, no rescue, and the market bleeds out for months. This is the painful, drawn-out scenario.
Scenario 3: A full 2008-style collapse. The FED lets something break, just like they let Lehman break, and the entire system cracks open. Bail-ins get activated, banks fall, savings get wiped, and the SP 500 sees a crash on the scale of 2008 or worse. This is a very real option, and I refuse to take it off the table.
I am positioned for all three, and depends on the targets the probability that we are at top area is extreme high. The only question left is how deep the FED is willing to let this fall, and based on inflation, based on Powell's own words, and based on the political climate, I believe the risk of scenario 2 or 3 is far higher than the market is currently pricing in. The top is in, or it is extremely close. I am short, and I am staying short with an invalidation once the FED starts printing once again!
The next weeks will be very important and many will miss out on real time updates and thats where premium is worth everything. It costs $59 / month and thats less than some of the trading fees you are paying! I cant repeat it more often but premium offers insights you are getting no-where else. Join here: https://t.co/kcREa27FtQ
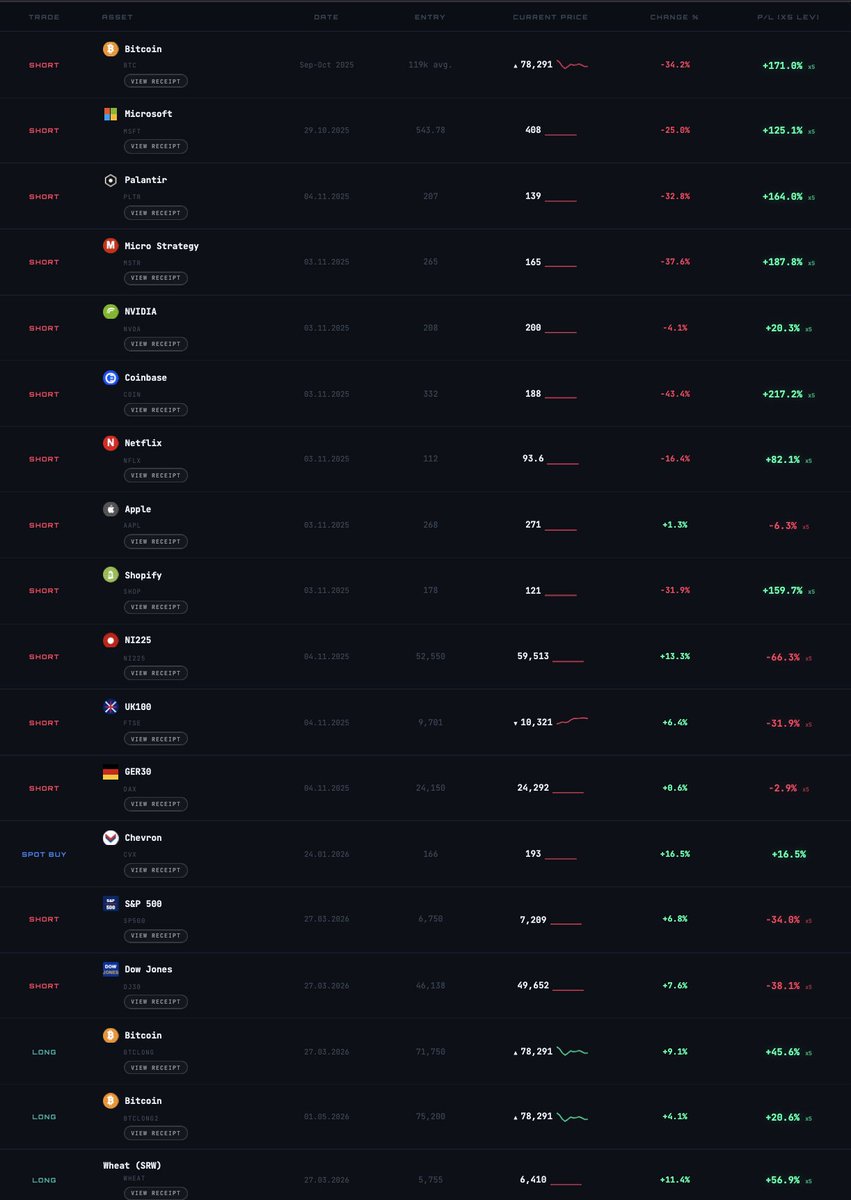
Month of May: running trades overview:
While entering the month of May, I am still holding the Bitcoin short from 120k, also multiple shorts of the stock market such as PLTR that was shorted at the exact top of 207 and held since 6 months+ for now. Some other positions have been opened recently, such as the SP500 short, the Bitcoin long at 71k, and two days ago a BTC long that was exclusively shared in premium only at 75,200, as well as a wheat long and 100 altcoin positions short that are not included in this list, and mainly all signals are exclusive for premium members only.
This is a monthly overview that is not an analysis model or something similar, but rather giving a clear and transparent overview of my current running trades, and I will continue to do so on the 1st of each upcoming month. Hope you like the idea. There are assets such as Gold and Silver, they are not included in the list as both are considered long-term trades, meaning I am buying and forgetting them. It's not futures or a trade I'm planning to close in months.
#Bitcoin – What’s Next?
The Big Sunday Report: All We Need to Know
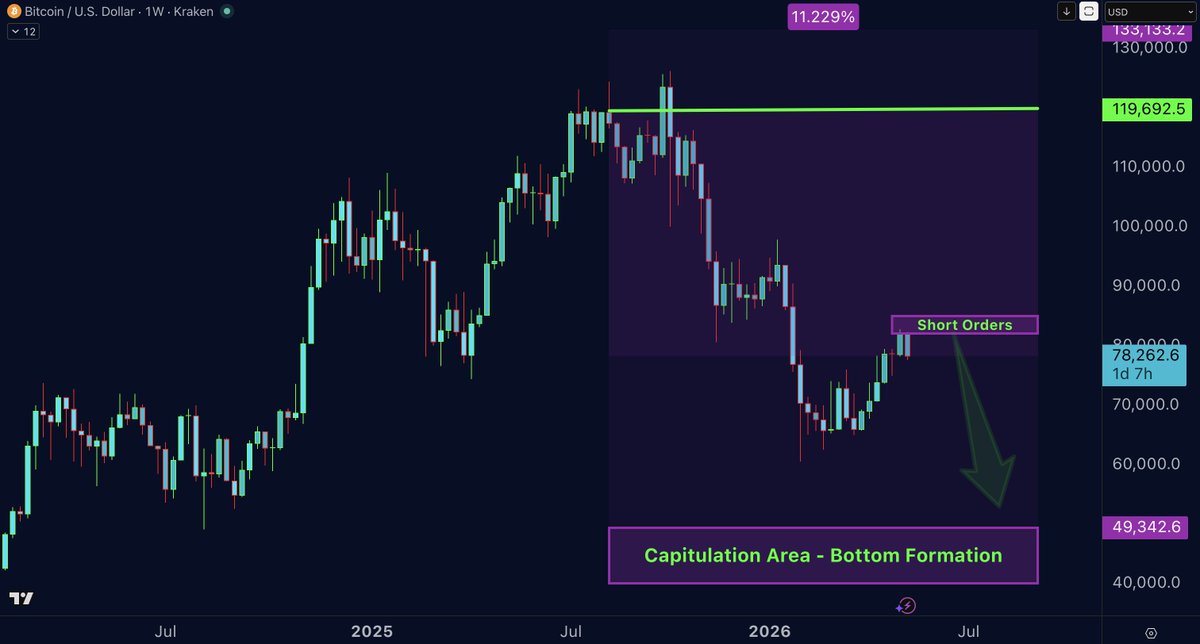
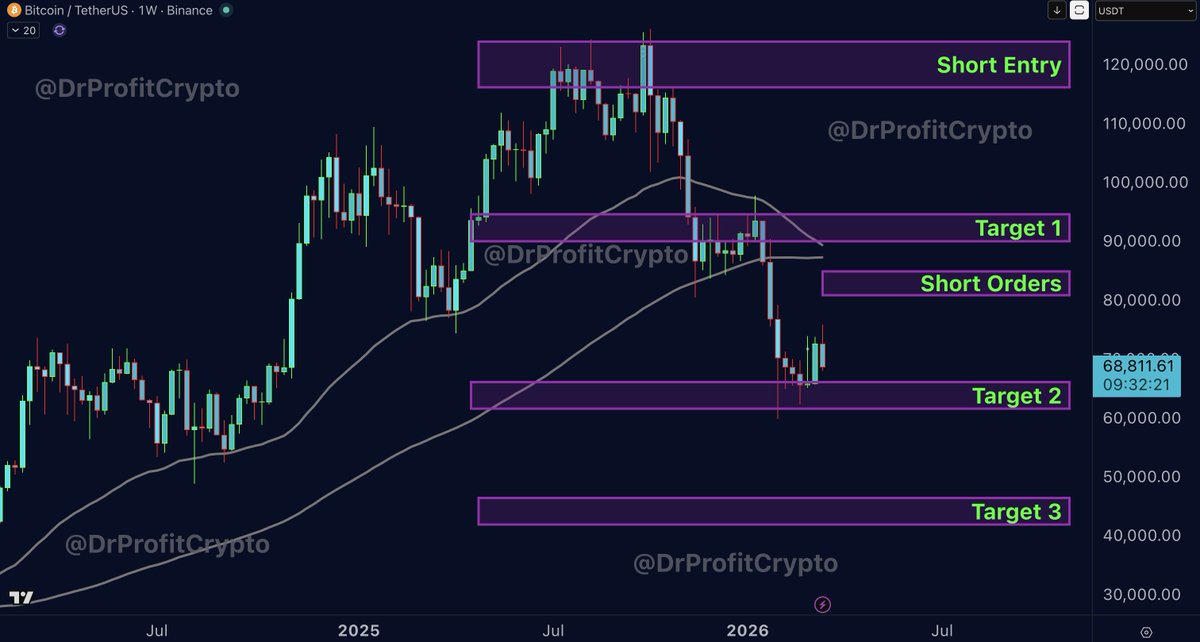
🚩 TA / LCA / Psychological Breakdown: First of all, I want to thank everyone for the DMs I have received in recent days. I understand the great profit we made and continue to make, as the long from 71k has proven to be more than profitable. In this Sunday report, I will explain where I am willing to take profits and enter into new shorts, as I have slightly adjusted my short entries and placed them slightly higher than what was planned at first. As I mentioned last week, 79–84k was a short area, however, I now consider 79–84k still a great area to accumulate shorts, but I am so certain we will see targets above 83k that most of my short orders are placed between the 83–85,500 region. This is very important to understand, as more than 90% of my short orders are located between 83–85,500, and trading is a game of rotation and finding the best possible entry. Here we go! At 83–85,500, I will take profits from the 71k long and add more shorts to the existing 120k short position.
Most people are not ready for the hammer that is being prepared, and soon you will see the start of slight euphoria in the markets. In Q4 2025, I called for the top at the 120k region and said 60k was coming. At 60k, I said prepare for a long sideways move within the box. Then I clearly said I was entering longs at 71k, as I was expecting the bull trap to play out, and we are exactly in my timeline and exactly within the bull trap the market makers are feeding us. You bite, and you can make good profits, but if you bite and become greedy, this is where you end up buying and longing right into the next local top. Yet we still have room to move further upside, and I am certain that we will visit higher targets in the short term, towards the 83–85k area at least, and prepare for the big downside move afterwards.
One thing is very important to keep in mind: we still have the yellow line that has not seen a retest yet, and it's only a 3% move from the 85k region to the yellow line, which is currently sitting at the 87,700 region. For that reason, I wouldn't put all my bets on the yellow line, but rather keep my SL far away from it, as this zone is something I consider not off the table before the big downside move.
Many of my followers who also follow other accounts and are being misled by them keep asking me why I haven't been shorting at 72k. Others tell me they shorted at 75k following some of these so-called "influencers" on X. And every single time, I ask the same question back: what is the reason to short here? And now we have the answer! Everyone who follows me knows I am expecting targets below 50k in the coming months, and this short-term upside move I called a long time ago. This is where it gets really interesting, because those influencers play a key role in market making. They will keep adding the fuel we use to push higher, creating more euphoria in the market, while their late shorts get liquidated and we move into the big downside. It will be a brutal event that is liquidating late bears and bulls! Both sides will lose unless you play it clever, and my approach proved to be more than accurate till this day!
As per Calendar, The FOMC meeting is set for Wednesday, April 29. Markets are not expecting any change! No hike or cut! This will be Jerome Powell's final FOMC meeting and press conference as Chair, as his term ends in May 2026, with Kevin Warsh widely expected to be confirmed as his successor and to chair the June meeting. Everyone says that Warsh leans more dovish, with rate cuts potentially resuming as early as the June or September meetings, and I highly doubt that! Overall, the meeting itself should be a non-event for rates, but the political subtext makes it one of the most closely watched holds in recent memory.
The next weeks will be very important and many will miss out on real time updates and thats where premium is worth everything. It costs $59 / month and thats less than some of the trading fees you are paying! I cant repeat it more often but premium offers insights you are getting no-where else. Join here: https://t.co/Ice9n2tMya
$BTC: At 60k I have been telling 79-85k is coming
Everyone else was shorting at 60k instead!
I bought spot at 68k and longed 71k instead!
Tell me who was right again and again?
The purest form of perfection in the art of trading
At 60k I have been telling 79-85k is coming!
Everyone else was shorting at 60k instead!
Tell me who was right again and again?
My big bet on Altcoins:
On top of my existing Bitcoin short from $120k and my ongoing SPX short, I'm now betting on the biggest hill of garbage the market has ever seen, even worse than during the dot com bubble and the garbage of the penny stocks. I'm shorting 100 altcoins simultaneously, 100 isolated short positions, $10,000 each, 1x leverage, total exposure of one million dollars. The exact altcoin names, and entries have been shared in the premium membership and are exclusive only. Isolated margin is the entire point: if any single coin pumps 100% and liquidates me, I lose $10k on that position and nothing else. The other 99 keep working.
Open any altcoin on the weekly, any of them and you're looking at the same chart: a multi-year bear market, price action back at levels we haven't seen since 2020, and a hill of garbage that continues to grow. Roughly 90% of this market is in a relentless, structural downtrend, and I cannot name a single catalyst that reverses it, not even all those X influencers who have been shilling this garbage for ages to you!
At 1x leverage, my max gain on any single short is 99%. My realistic expectation is a further 50% drop, which is on a $10k short: $5,000 in my pocket. Apply that across 100 positions and you're looking at roughly $500,000 in profit, against a theoretical max loss that would only materialize if EVERY SINGLE OF THE 100 altcoin, pumped 100% in total!
And for anyone who watched my prediction of October 10th, 2025 unfold, the cascade that took most altcoins down 50 to 80% in a single session, understand what you actually saw. That was the final liquidity grab. A major market maker pulling the plug and walking away from this market for good. What's left behind is thousands of bleeding bags with nothing underneath them but trapped liquidity and retail hopium. I'm not guessing at what these coins are. I know exactly what I'm shorting: garbage. And the beautiful thing about garbage is it always ends up in the same place. This is the penny-stock playbook, except this time the opportunity set isn't in the dozens, it's in the thousands of ten thousands of fully retarded, liquidity filled altcoins that are ready to get milked! And I'm already milking it.
Join Premium: https://t.co/kcREa28djo
#Bitcoin – What’s Next?
The Big Sunday Report: All We Need to Know
🚩 TA / LCA / Psychological Breakdown:
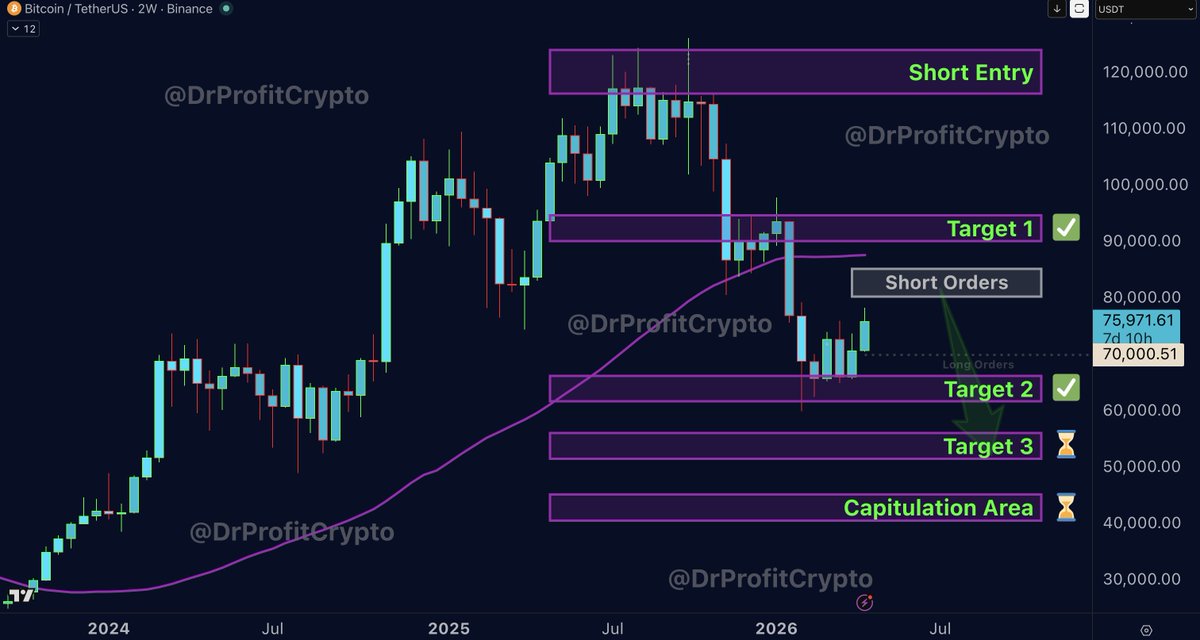
I can't believe that many are now calling that the bottom was in and the bear is over, or even worse that a new ATH is coming. To make it clear, Bitcoin remains in a strong bear market and what we see now is a relief rally within the bear market. Do you know that during the bear market in 2022 Bitcoin went from 68k to 33k almost straight down, then Bitcoin went up from 33k 45% to 48k before crashing down to 16k. Some people with a small IQ, and those who can't understand time frames can't understand this, this is why you notice a lot of comments such as "Weren't you bearish all the time?" "Now you are turning bullish". In fact, I have been calling for 79-84k since the 60s region, and always said it's not off the table and if the market allows to visit it I will short! So we entered spot at 68k once, and a long at 71k another time. If your brain struggles to hold two different timeframes at once, that is not a market problem! Bitcoin is moving within its box I shared in February 2026. Remember the line "Interested to Short here"? We are coming close to this area! And on top we are in a long since 71k and aiming for the targets of 79-84k region! Now I will add something new to the set-up and it's very important to understand this well:
I am placing new long orders at 70k region in case market allows to visit, due to Monday open volatility. This order remains valid and becomes invalid once we hit 79-84k first. In case 79-84k is not hit first, the long order at 70k region remains valid.
I believe that we are within a strong bear market and my shorts from 115-125k remain fully open and I am looking for target 3 which is between 50-56k region! I am confident that we will hit this target in the next 1-2 months! Market makers are preparing a trap, to make the markets look healthy and strong, and are doing everything possible to increase the price with futures rather than with spot purchases. The volume clearly shows a future-driven increase rather than a spot-driven increase, another sign of strong manipulation, and we don't complain but use this as an indicator for our own favor.
The region of 79-84k is very interesting, and within the last 1-2 weeks the region of 82-85k became more interesting as well, and this doesn't change anything in our short orders but it changes the % of how much I am placing at each area, and again education is important and I hope it's understandable for all. Let's take an example of a budget with $100,000 and in this case I would place with a x5 leverage.
$5,000 at $79,250
$5,000 at $80,250
$5,000 at $81,250
$5,000 at $82,250
$10,000 at $83,500
$20,000 at $84,250
$30,000 at $84,500
$20,000 at $85,000
This is an example and shows approximately how aggressive and in what region I am willing to add what, and how much at each region. Also its clear that I am going to close my 71k longs in the same method (Amount) as mentioned above. Many don't understand trading with orders and how you can target an entire area rather than one specific number. In the example shown above you will notice that the region of 84-85k is targeted with most of the aggressive orders, and before with only 30% of the capital. Most are not ready for whats coming and during these days my focus is on the SP500 as well! I am preparing the big short on SP500 and have shorted it from 6400, 6800 and 6900! Planning to add more shorts in the coming days as I believe the big downside move for SP500 is coming soon! And this is when Bitcoin will react and we will see the strong and next leg down. I see the SP500 crash to happen within this quarter, during this times I will keep adding shorts on SP500!
The next weeks will be very important and many will miss out on real time updates and thats where premium is worth everything. It costs $59 / month and thats less than some of the trading fees you are paying! I cant repeat it more often but premium offers insights you are getting no-where else. Join here: https://t.co/Ice9n2tMya
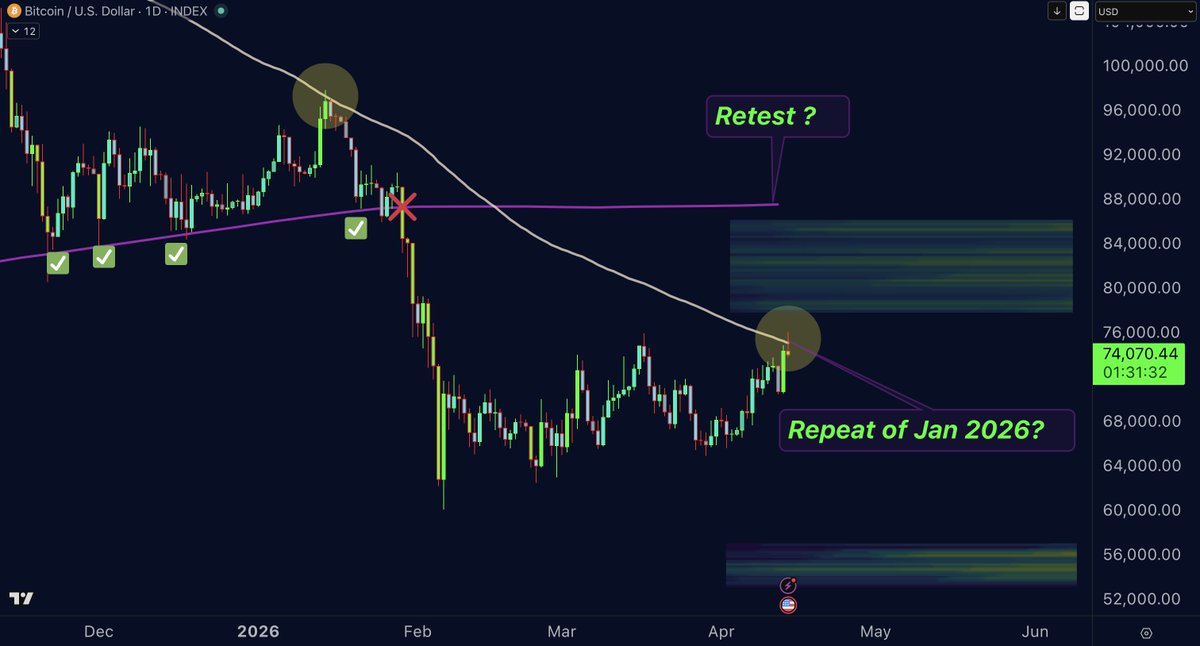
#Bitcoin: The chart that explains everything!
Everyone who is saying that we don't have liquidity below is lying or has no clue what they're talking about. In fact, we have tons of liquidity between the 53-57k region and tons of liquidity between the 76-85k region. Market makers usually hunt both sides and that's what makes the current setup dangerous for most traders who don't understand the full view.
The full view is as follows: Bitcoin is now at 74k, we have a strong resistance line (White Line) that was also rejected in January 2026 and led to the next big leg down. Bitcoin touched this resistance today and got rejected once again, but now we have the golden question: will market makers ignore the liquidity above? I doubt it. So that's why I placed my short orders right into the liquidity area between 79-84k in case market makers allow a visit, and while doing so, they can also retest the break of structure (Purple Line) that happened in January 2026. So the question that remains is: How high will market makers move before the next leg down? Is it going to be the white line or the purple line? The answer can be found in the liquidity below.
Since January I have been talking about a boring, continued sideways move happening for one reason only, to create more and more liquidity below. In January there was almost no liquidity below 60k, so why would market makers drop the price lower if there is nothing left to take? That's the moment market makers start moving price sideways to build liquidity on the downside. If market makers are not satisfied with the liquidity below, they will manipulate price with futures longs and let the masses believe the bullish momentum is back. That's the trap that is currently in play. It's like standing in front of two holes of the same depth, one requires more work to dig, the other is easier. That's exactly what the white and purple lines represent. And the longer you wait to dig, the more gold you find at the bottom. That's the reason for the sideways move we are seeing.
Overall, it's very important to understand that Bitcoin remains fully bearish. We will visit lower targets, and right now we are inside a bullish trap, the only open question is whether that trap ends at the white line, or whether market makers take the liquidity higher and end it at or near the purple line. That question can't be answered right now, but we will have more clarity once we see how price reacts at the white line, which has been rejected so far. This is why I said the sideways move would take a long time. Most people didn't expect it to drag into April, but I kept saying it would take 3 to 4 months. The decision point is now very close.
Join DrProfitPremium: https://t.co/Ice9n2tMya