


$Larry @MEETCRYPTOBRO
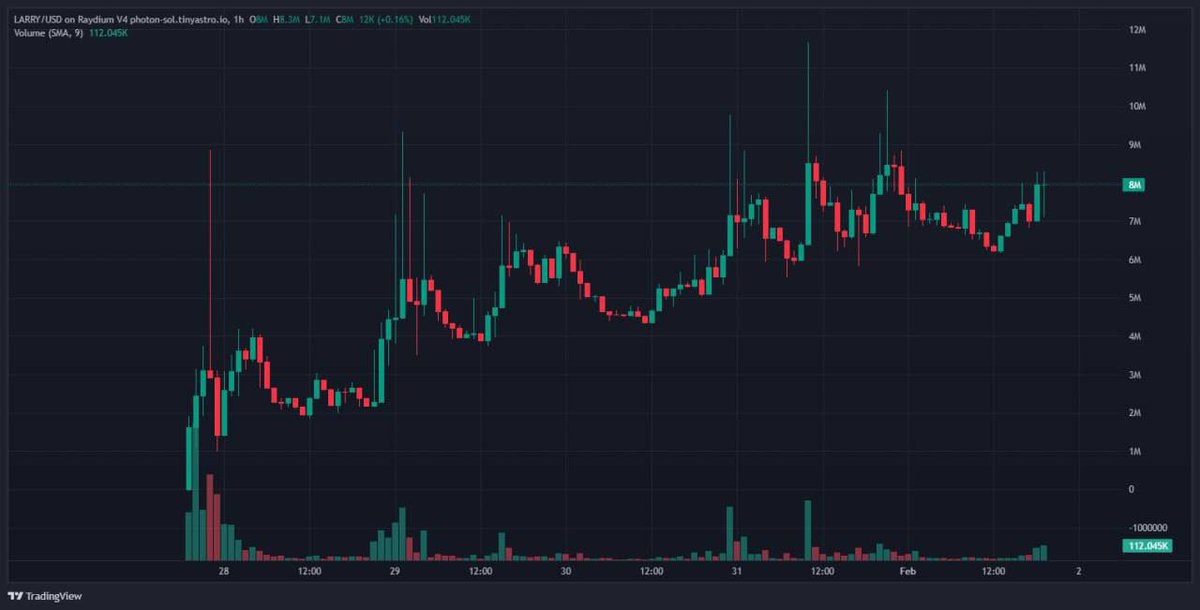
1. **Overall Trend**: The chart depicts a sideways trend, with intermittent spikes in price action.
2. **Key Levels**:
- **Resistance Level**: Around 10M.
- **Support Level**: Approximately 7M.
- There are no clear moving averages provided in the chart data.
3. **Notable Patterns**:
- Noticeable volatility with sharp price spikes, indicating active trading.
- The price has bounced off the support level multiple times, suggesting it’s a significant area.
4. **Trader Insights**:
- Traders might consider monitoring for either a breakout above resistance for potential bullish momentum or a drop below support, which could indicate bearish sentiment. Volume spikes may signal upcoming price movements.
From X
Disclaimer: The above content reflects only the author's opinion and does not represent any stance of CoinNX, nor does it constitute any investment advice related to CoinNX.