


$ALVA analysis using @SEEKBNBAI AI image analyzer @AlvaraProtocol 🚀
Try it now : https://t.co/fLgmtxq92f
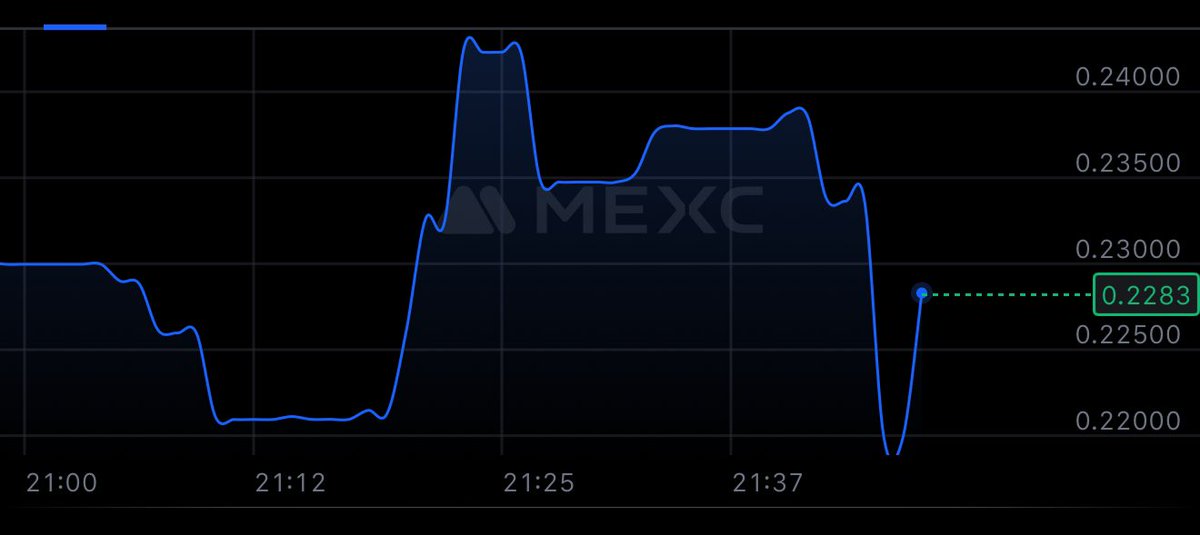
1. **Time Frame**: The x-axis indicates time segmented into specific points (e.g., from 21:00 to 21:37).
2. **Price Movement**: The y-axis reflects the price, ranging from about 0.22 to 0.24. There are visible fluctuations throughout the given period.
3. **Trends**:
- The price starts relatively stable but shows a noticeable peak before 21:25.
- After hitting the peak, a sudden drop occurs, which indicates volatility.
- There’s a slight recovery towards the end of the observed timeframe, with the price stabilizing around 0.2283 just before 21:37.
4. **Volatility**: The sharp fluctuations suggest that there might have been significant trading activity or market events influencing the price
From X
Disclaimer: The above content reflects only the author's opinion and does not represent any stance of CoinNX, nor does it constitute any investment advice related to CoinNX.