


Perry @perry_binance send it on @BNBCHAIN & @four_meme_ 🚀
$Perry
0x5043F271095350c5ac7db2384A0d9337E27c1055
Using @SEEKBNBAI
https://t.co/fLgmtxq92f
是我们的时间,表姐。
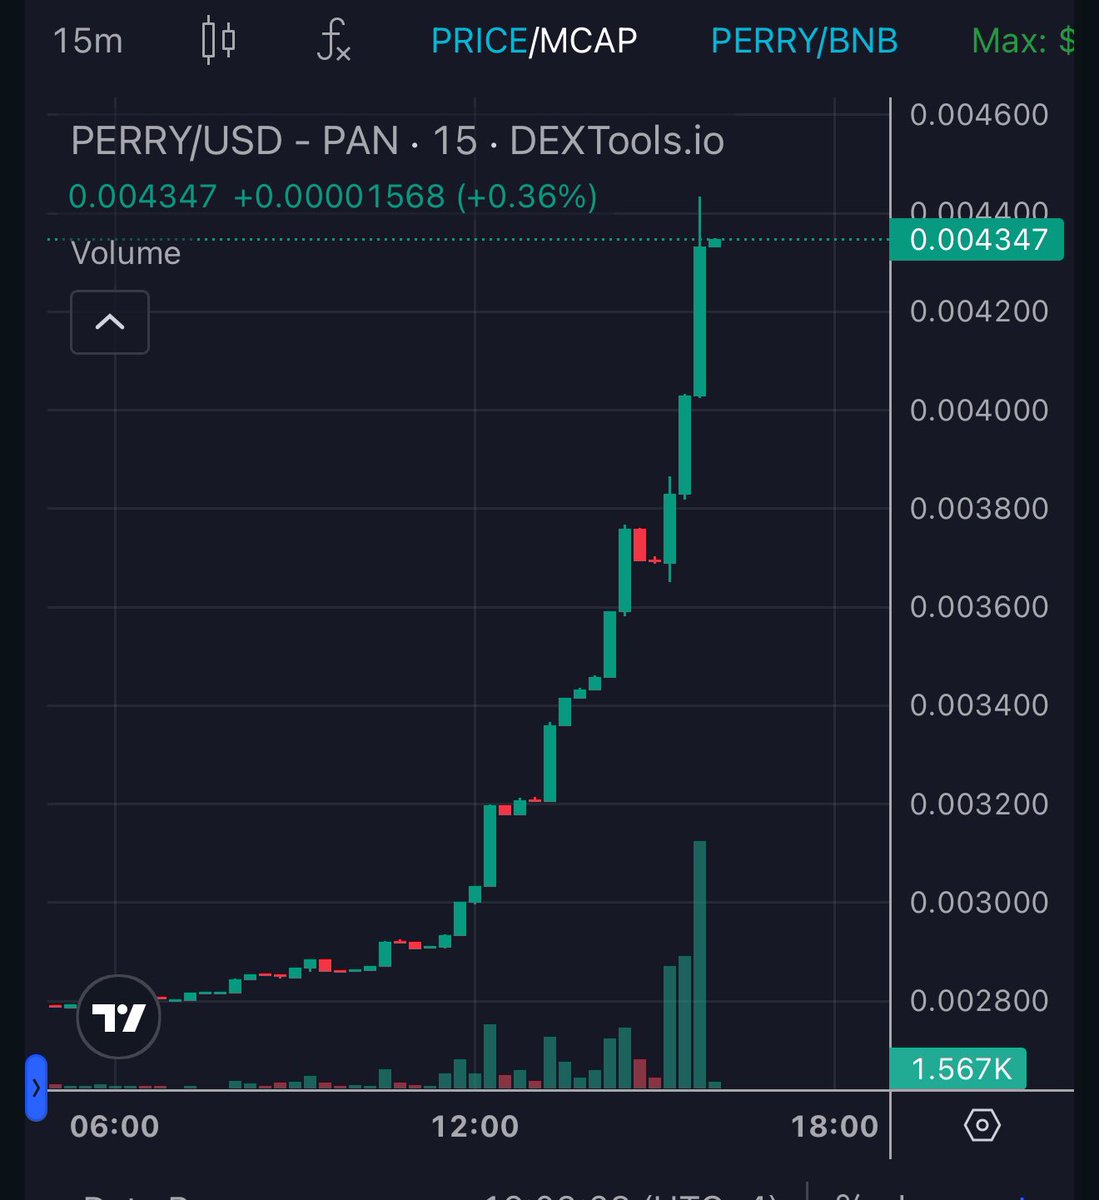
The image depicts a candlestick chart for the trading pair PERRY/USD on a decentralized exchange, likely used for tracking changes in price over time. Here’s a breakdown of the key elements:
1. Time Frame: The chart appears to represent a 15-minute interval, showing price movement throughout the day.
2. Price Movement:
- The price has experienced a significant upward movement, particularly evident in the tall green candlestick on the right, indicating a rapid increase in value.
- The price started lower in the earlier part of the day and steadily increased, culminating in a sharp spike before stabilizing around 0.004347.
3. Market Sentiment: The sharp upward trend may indicate bullish sentiment, often resulting from positive news, influential market events, or increased buying interest.

From X
Disclaimer: The above content reflects only the author's opinion and does not represent any stance of CoinNX, nor does it constitute any investment advice related to CoinNX.