

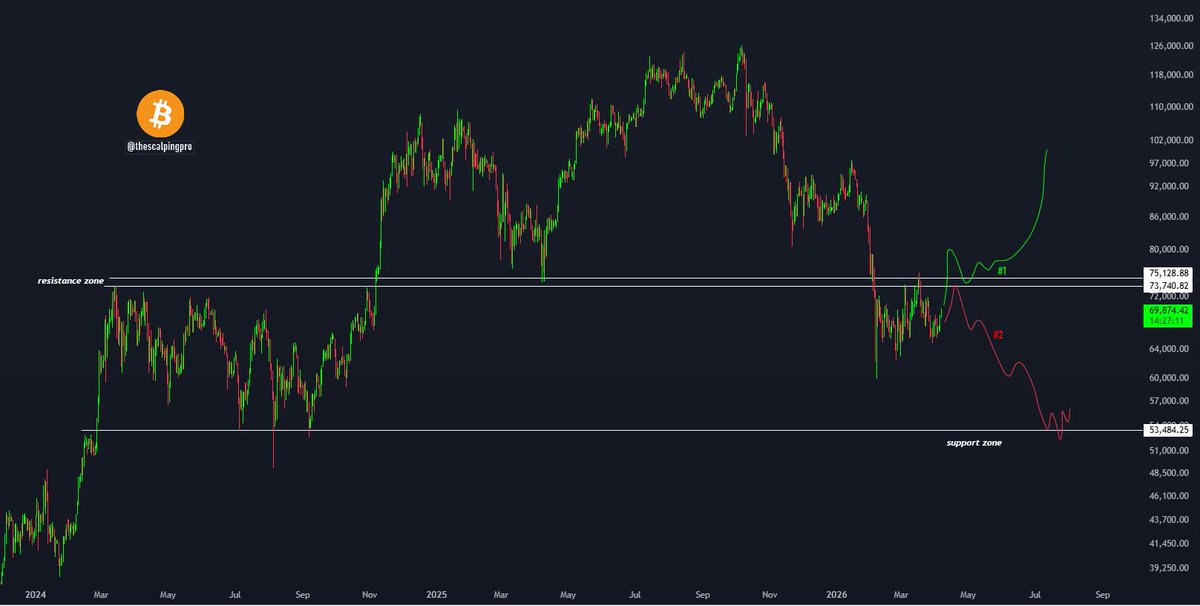
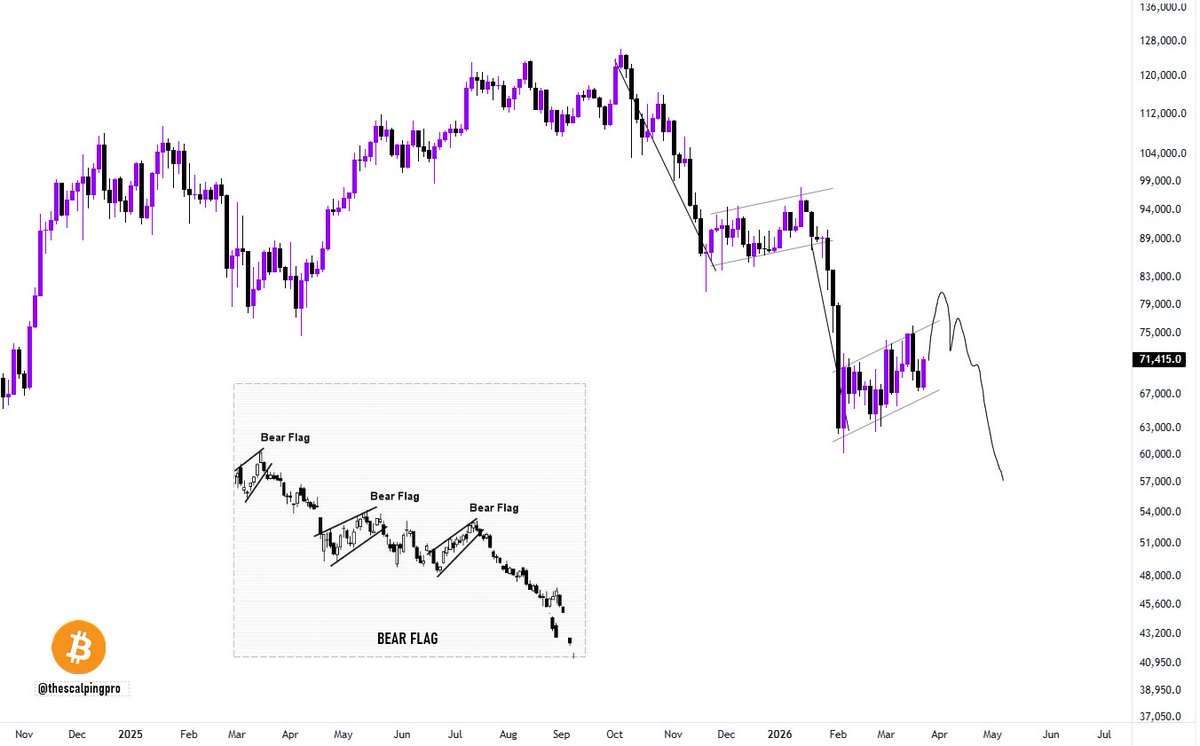
#Bitcoin - The final leg down coming?
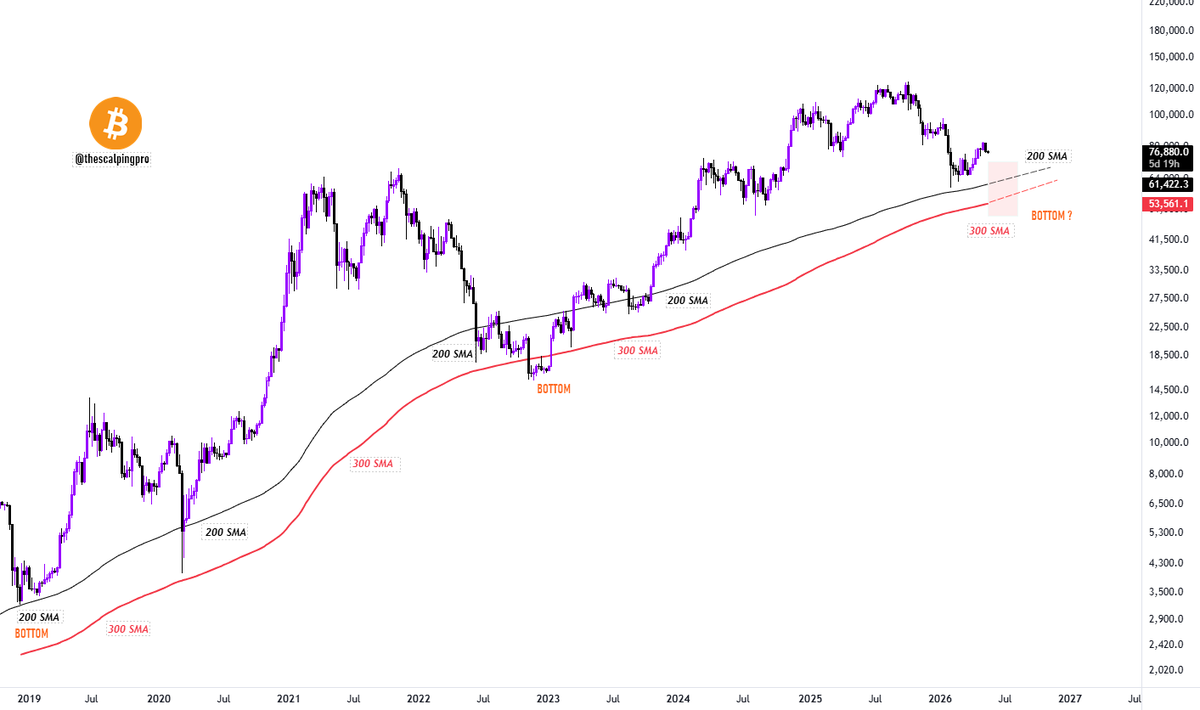
In every cycle, the 200 & 300 MA have acted as key support zones for BTC.
• 2018 - BTC bottomed at the 200 MA
• 2022 - BTC broke below the 200 MA and bottomed below the 300 MA
Now in 2026:
• 200 MA sits around $61,400
• 300 MA sits around $54,500
The HTF structure has also turned bearish.
If BTC takes another leg down, there is a strong possibility of price testing the 200–300 MA zone again.
Historically, this area has acted as a major support and could potentially form the next bottom.

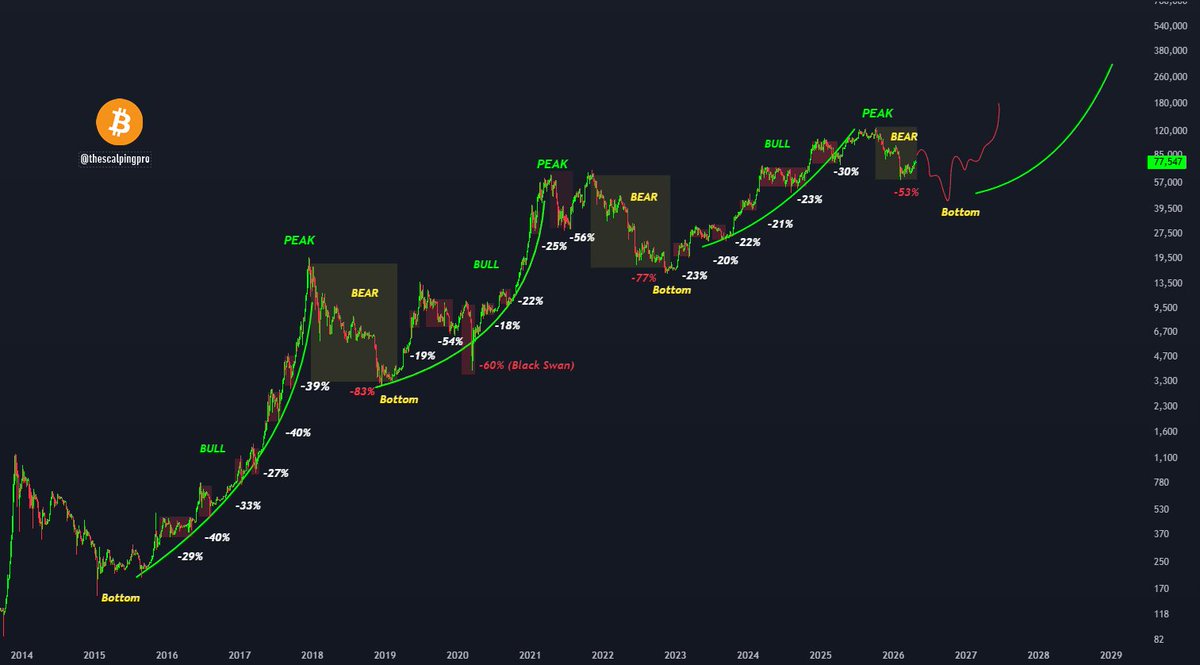
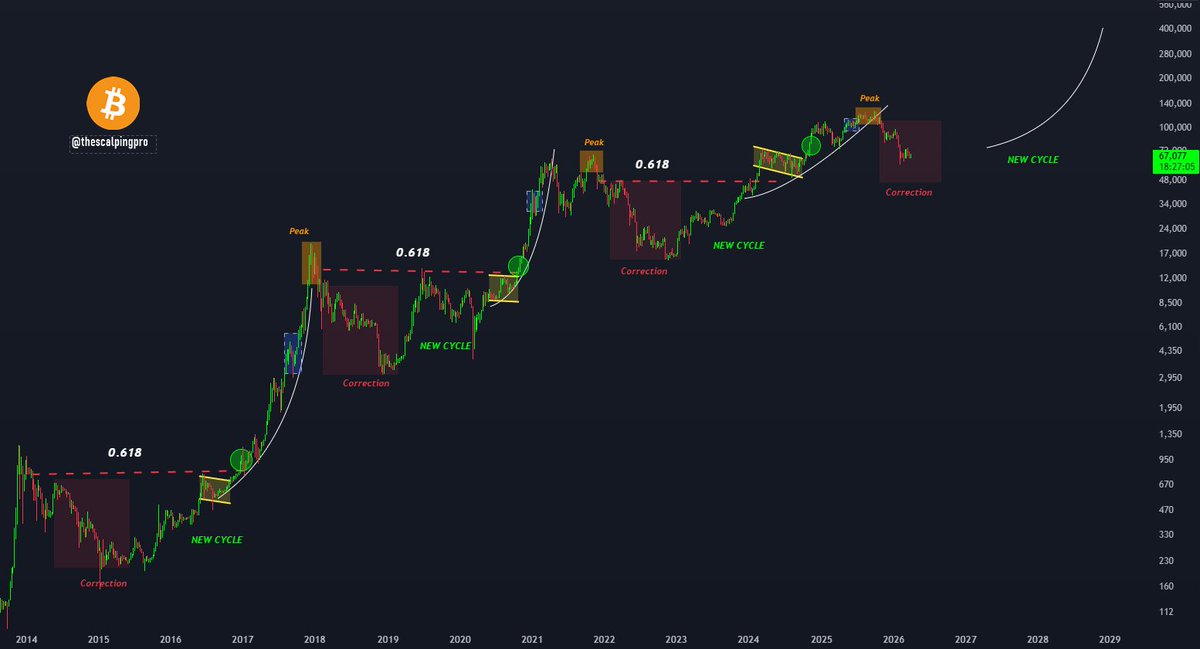
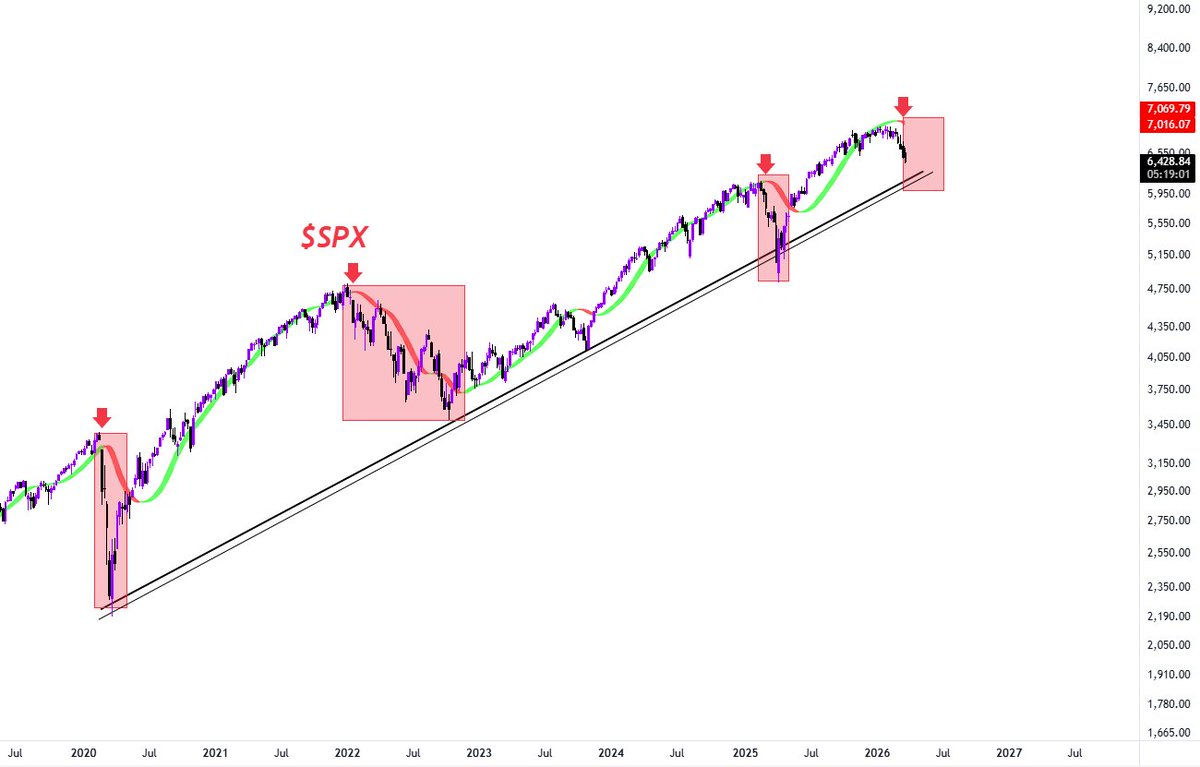
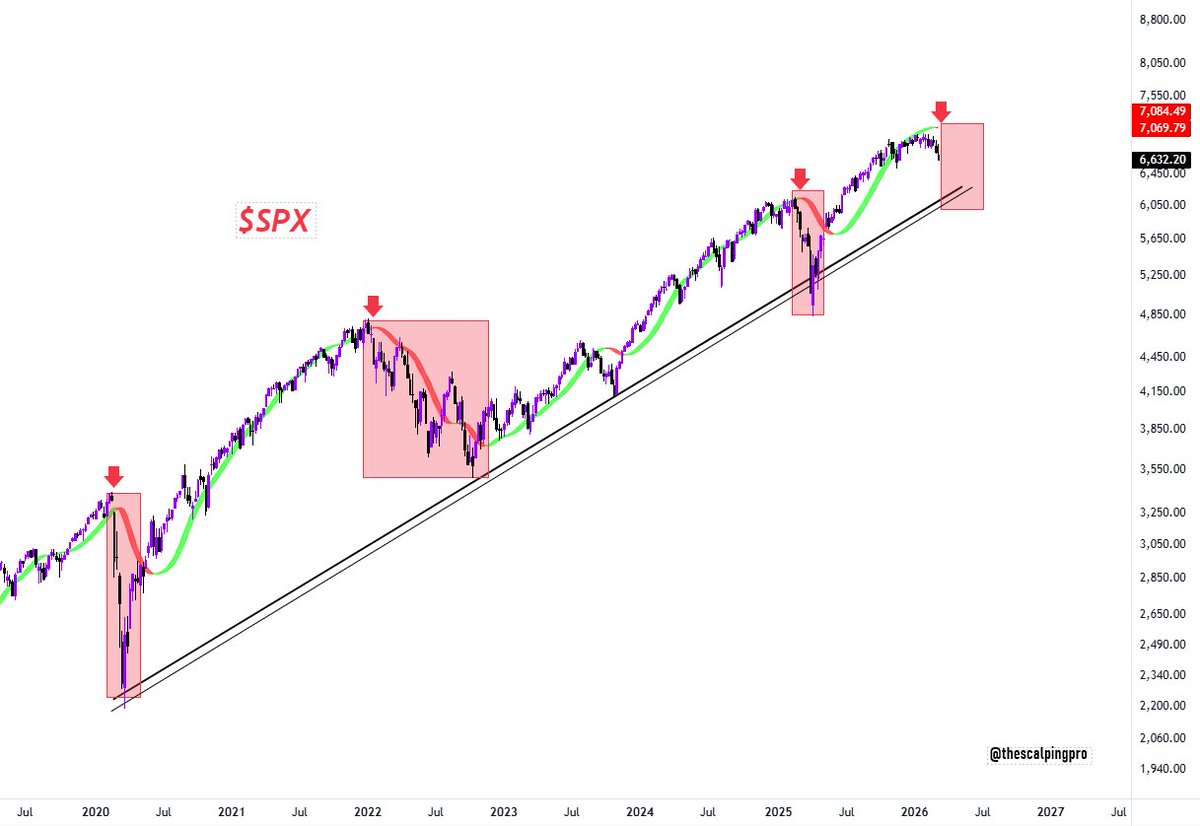
#Bitcoin - If you hate corrections, you can’t be rich
The market moves in two phases:
i) Bull phase :
The trend is upward, but it’s never a straight line. Price goes through multiple 20–30% pullbacks before reaching a cycle top.
These corrections are normal and happens during each cycle, they reset the sentiment and fuel continuation.
ii) Bear phase
This begins when the market structure breaks. Price sees a deeper correction, eventually forming a bottom before a new trend starts.
Both phases bring volatility. That never changes.
What matters is recognising where you are in the cycle.
Historically, every cycle has rewarded those who understand the long-term game.
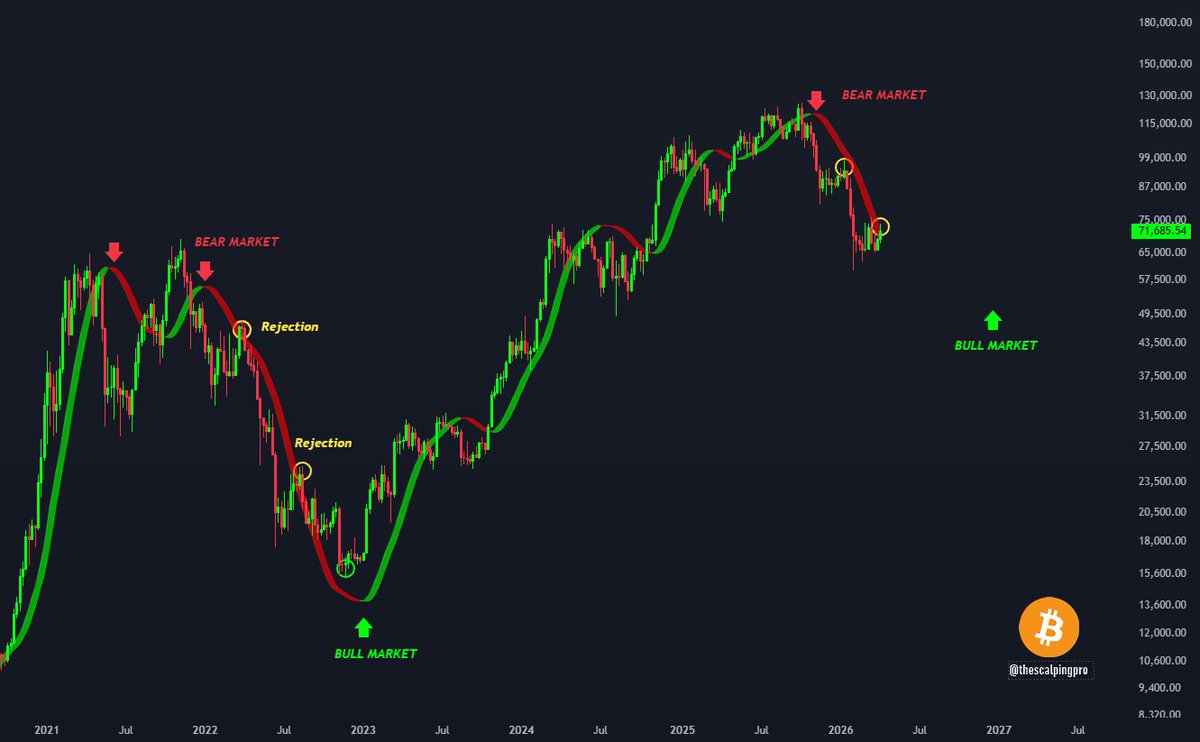
#Bitcoin - Buy if the Bands Flip Green
The Hull Suite Bands turned red in November 2025, signaling the start of the bear market.
Since then, price has stayed below the bands.
Currently price is making its second attempt to break above the bands - Still no confirmation
In the last bear market, the price faced two major rejections from these bands, but when it finally flipped green.
It marked the beginning of a bull run.
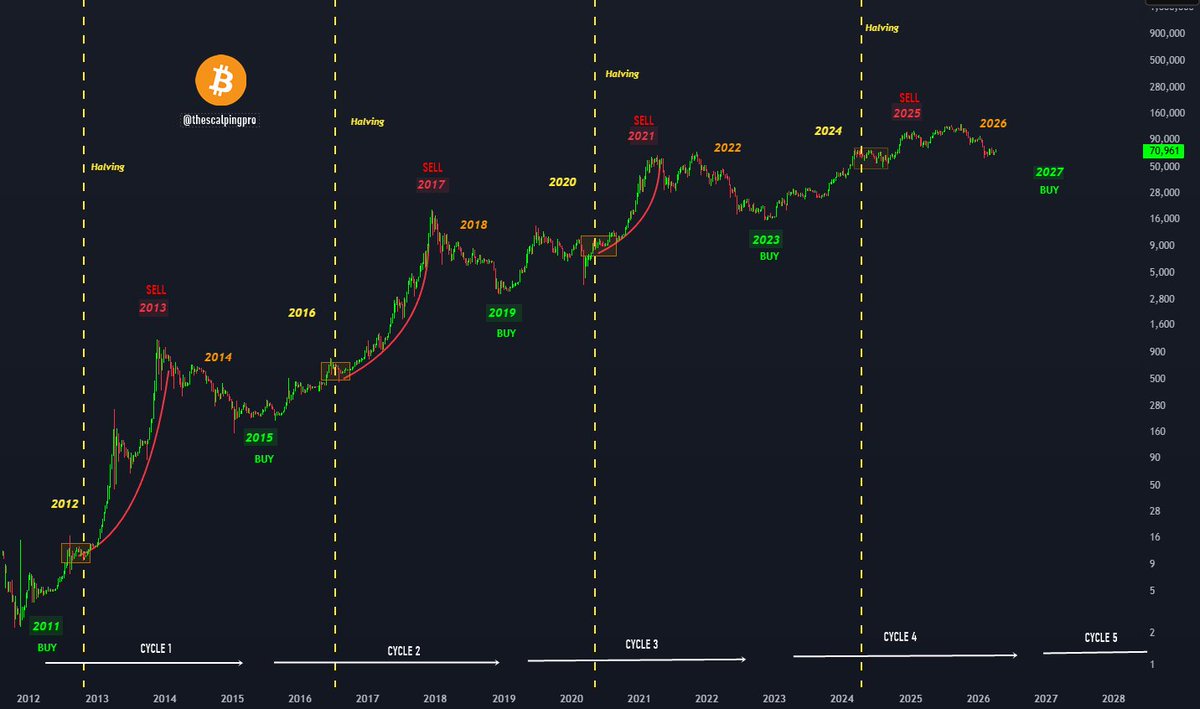
#Bitcoin - The 4 Year Cycle is over? 🤔
Cycle 1 (2011 - 2014)
2011 - Buy
2012 - Hold
2013 - Sell
2014 - Bear Market
Cycle 2 (2015 - 2018)
2015 - Buy
2016 - Hold
2017 - Sell
2018 - Bear Market
Cycle 3 (2019 - 2022)
2019 - Buy
2020 - Hold
2021 - Sell
2022 - Bear Market
Cycle 4 (2023 - 2026)
2023 - Buy
2024 - Hold
2025 - Sell
2026 - Bear Market (we are here)
Cycle 5 (2027 - 2030)
2027 - Buy
2028 - Hold
2029 - Sell
2030 - Bear Market
So far the 4 year cycle is still on track and everything is playing out perfectly.
If the structure holds, 2027 becomes the next major accumulation window.
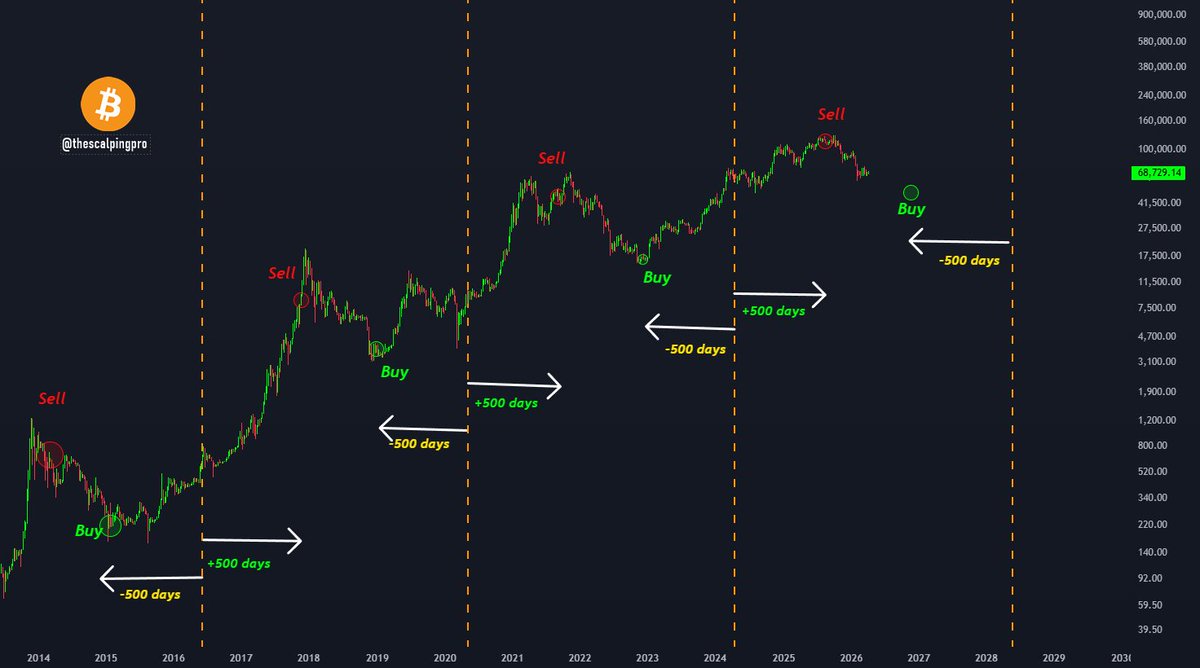
#Bitcoin - Buy BTC on 13th January 2027 🚨
The 500 Day Bitcoin strategy is still on track -
i) Buy Bitcoin 500 days before the halving
ii) Hold and do nothing
iii) Sell 500 days after halving
iv) Repeat
According to this strategy, the last sell signal was triggered on 24 Aug 2025, when Bitcoin was trading around $109K. BTC is already down 45% since then.
The next halving is estimated around 27 May 2028.
If we go 500 days before the halving date, the next buy window lands on 13 Jan 2027.
That means the strategy suggests accumulation around January 2027.
I have already talked about this before.
Tokenized commodities will be a strong narrative
Ubuntu Tribe called it early :
Gold → Digital
Gold → regulated
That was in their Gold For All Report last year.
$GIFT Gold is also LIVE already + MiCA-aligned.
That’s a level of regulatory clarity most projects don’t have..
They’re also opening access to the report via a Zealy campaign.
Make sure to participate & give them a follow - @UtribeOne

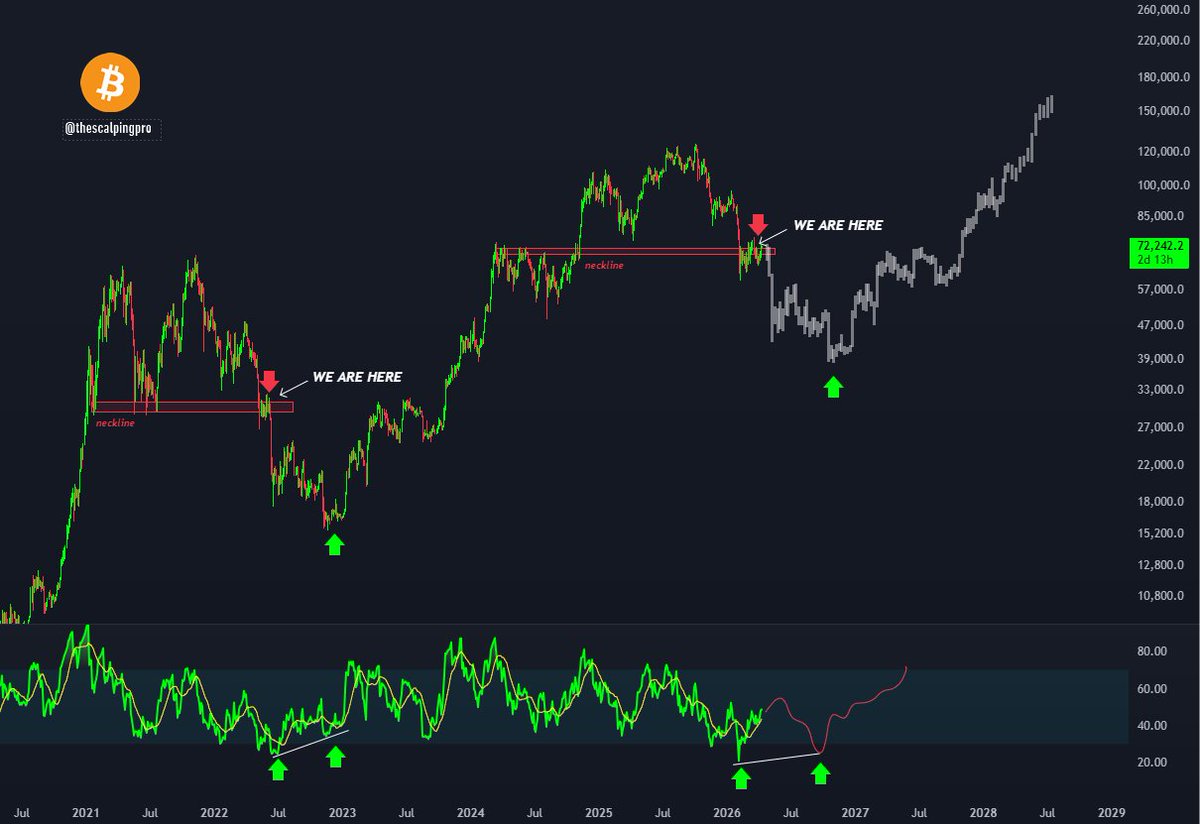
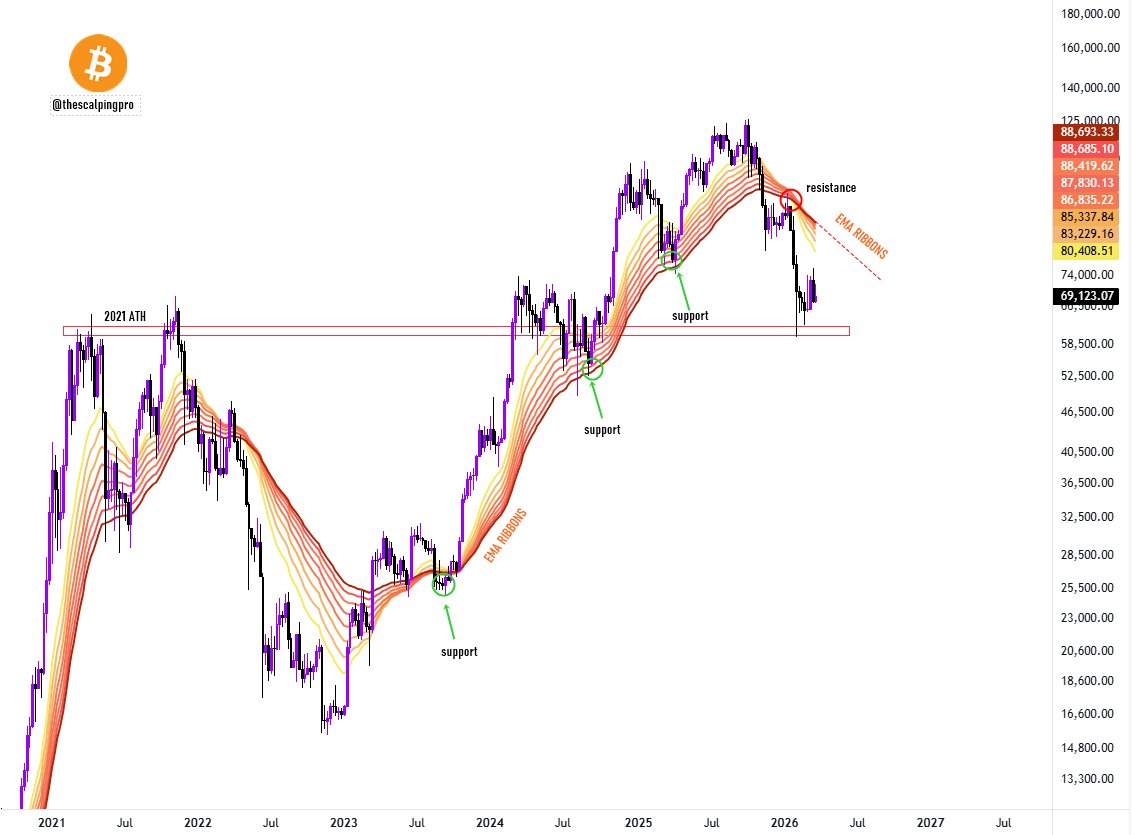
#Bitcoin is currently trading below the EMA ribbons.
These ribbons have historically acted as strong support and resistance across market cycles.
During the bull market, price tends to hold above them and use the ribbons as support zone. In bear market, the same ribbons flips into resistance.
In this cycle BTC broke down the EMA ribbons back in November 2025 after printing the ATH of $125,500 and later confirmed it as resistance.
That shift signaled a change in trend and the start of a downtrend.
Right now, price is still holding above the 2021 ATH, which is an important level to watch.
However, as long as Bitcoin continues trading below the EMA ribbons, the overall trend remains bearish.
Tokenized commodities will be a strong narrative?
UtribeOne caught my attention while digging into altcoins and it’s worth watching.
They’ve been early on the idea of bringing physical gold on-chain, focusing on regulation, redemption, and real-world integration.
Their $GIFT gold token is live - built around real collateral, transparent infrastructure, and global accessibility.
• Physical gold backing
• On-chain transparency
• Global liquidity
• No leverage exposure
• No synthetic risk
While many altcoins rely purely on speculation, tokenized gold sits in a different category combining traditional store of value with digital efficiency.
Give them a follow - @UtribeOne🤝
Their Zealy Quest also went live do check it out.

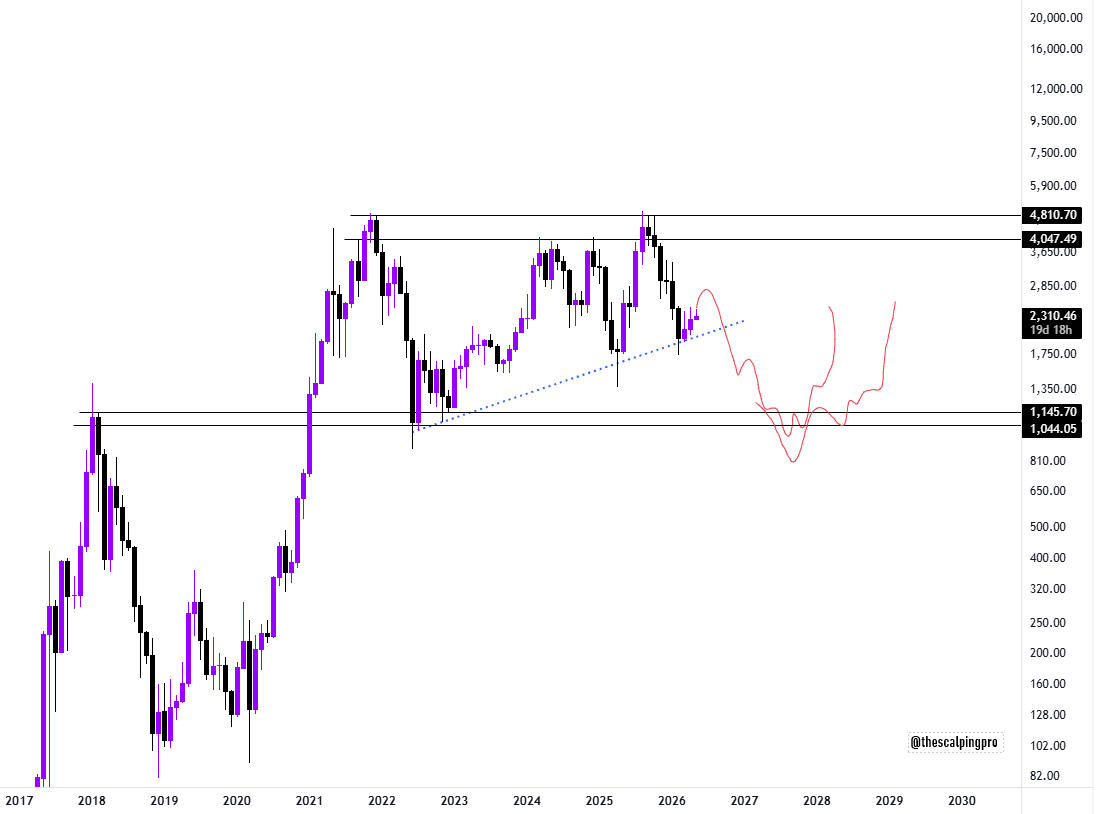
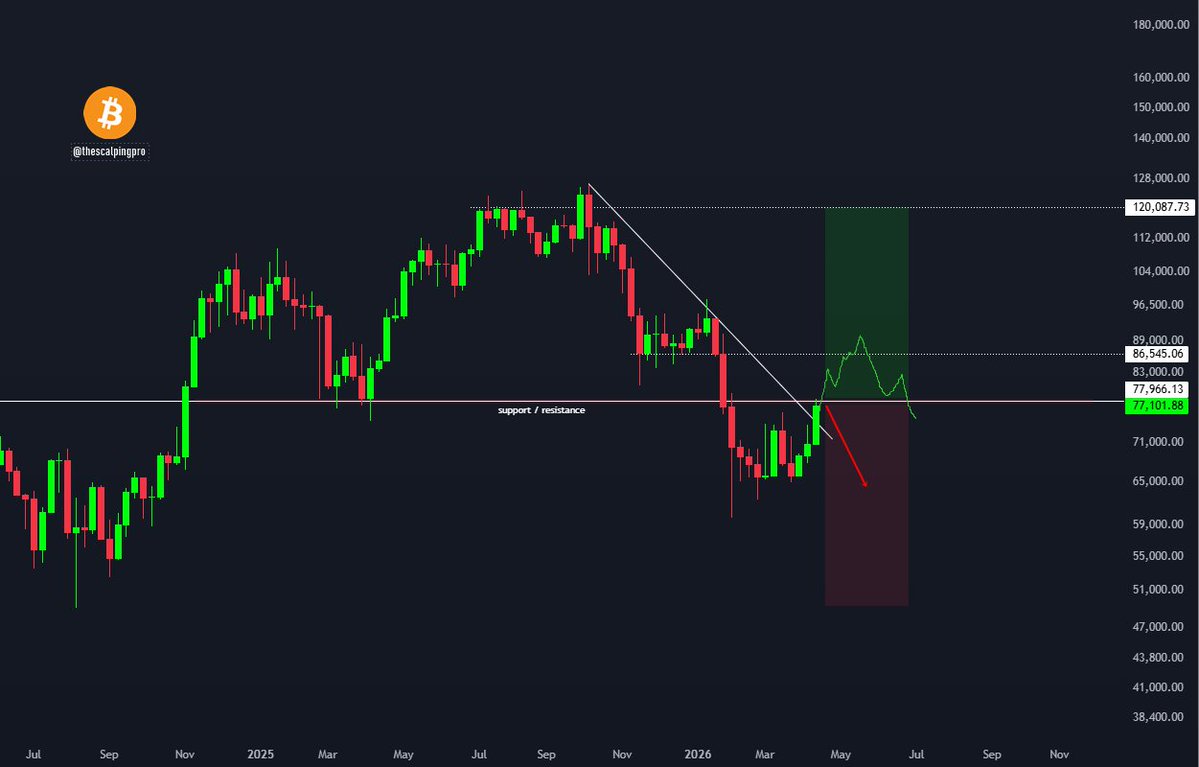
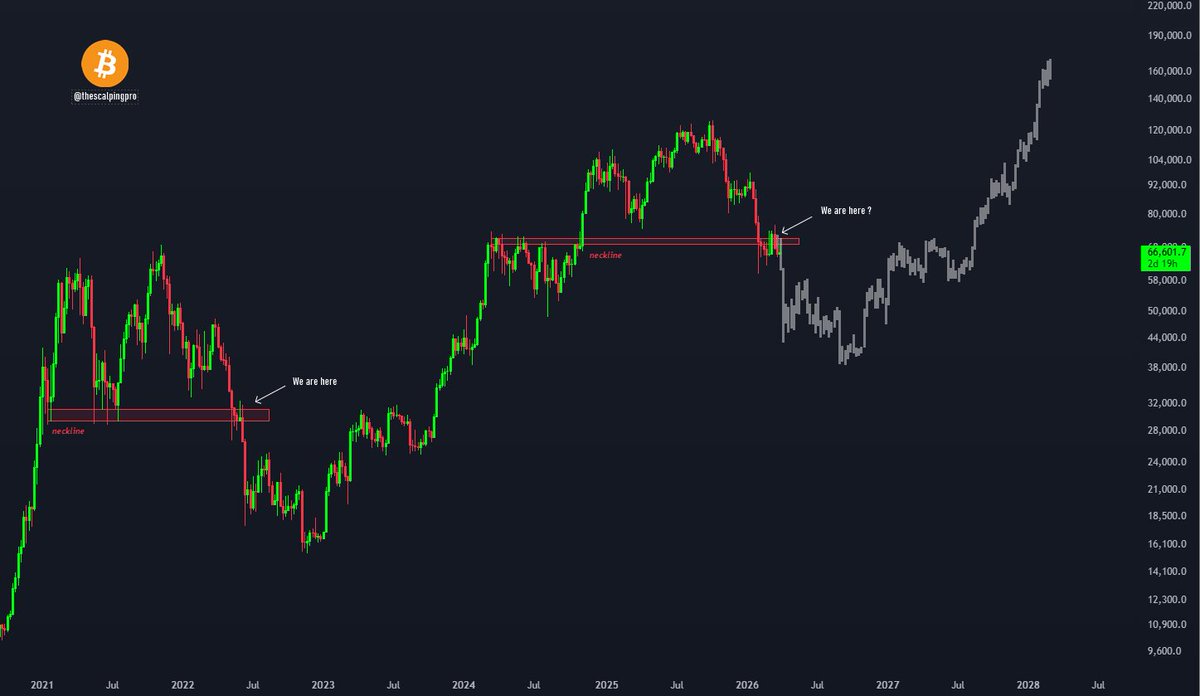
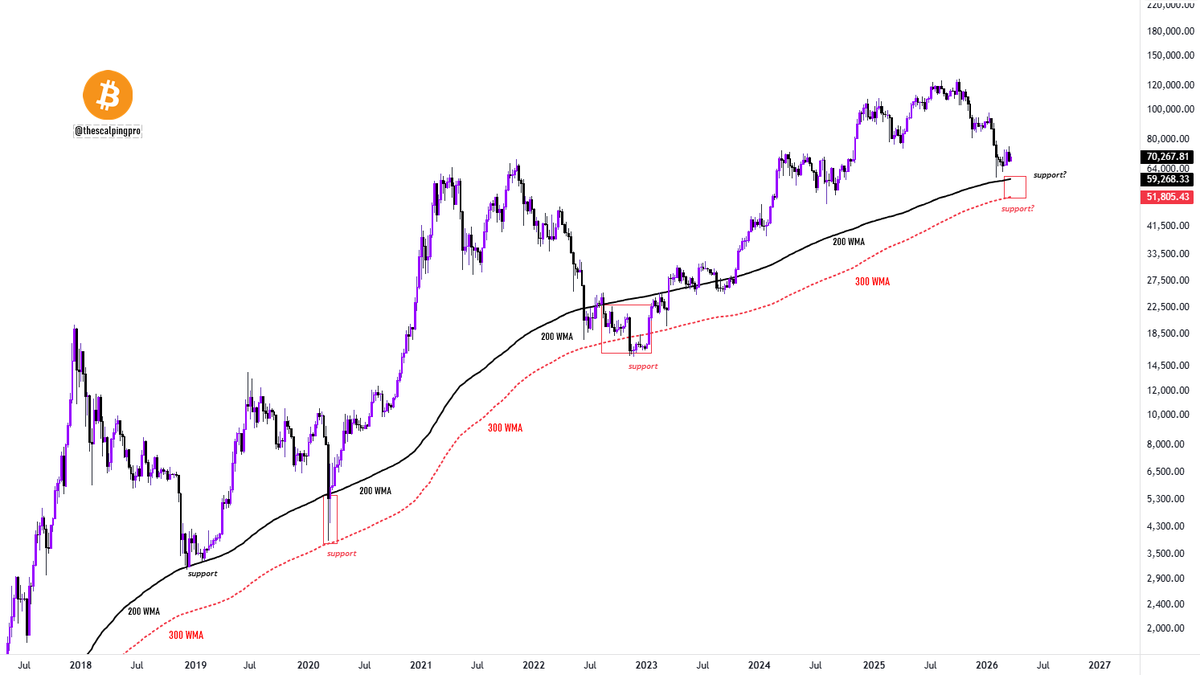
#Bitcoin - the bottom is close ✍️
Price has been in a downtrend since Oct 2025, already correcting ~50% from the ATH.
The 200 & 300 WMA have acted as strong bottoming zones for Bitcoin in the past:
• 2018 - BTC bottomed at the 200 WMA
• 2020 (CVID crash) - BTC bottomed at the 300 WMA
• 2022 (FTX collapse) - BTC bottomed near the 300 WMA
Right now, price is trading near the 200 WMA but hasn’t actually tested it yet.
Key levels to watch:
200 WMA - $59,268
300 WMA - $51,805
Price is entering a high-probability long term accumulation zone.
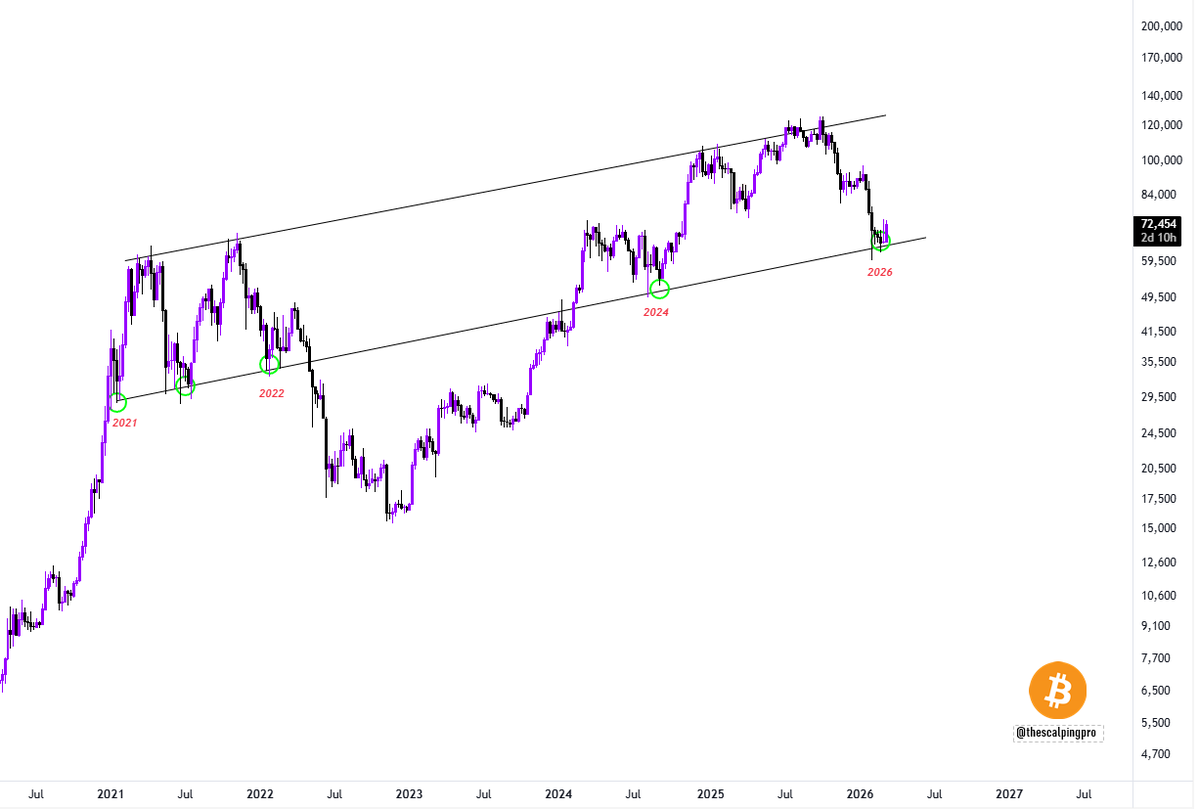

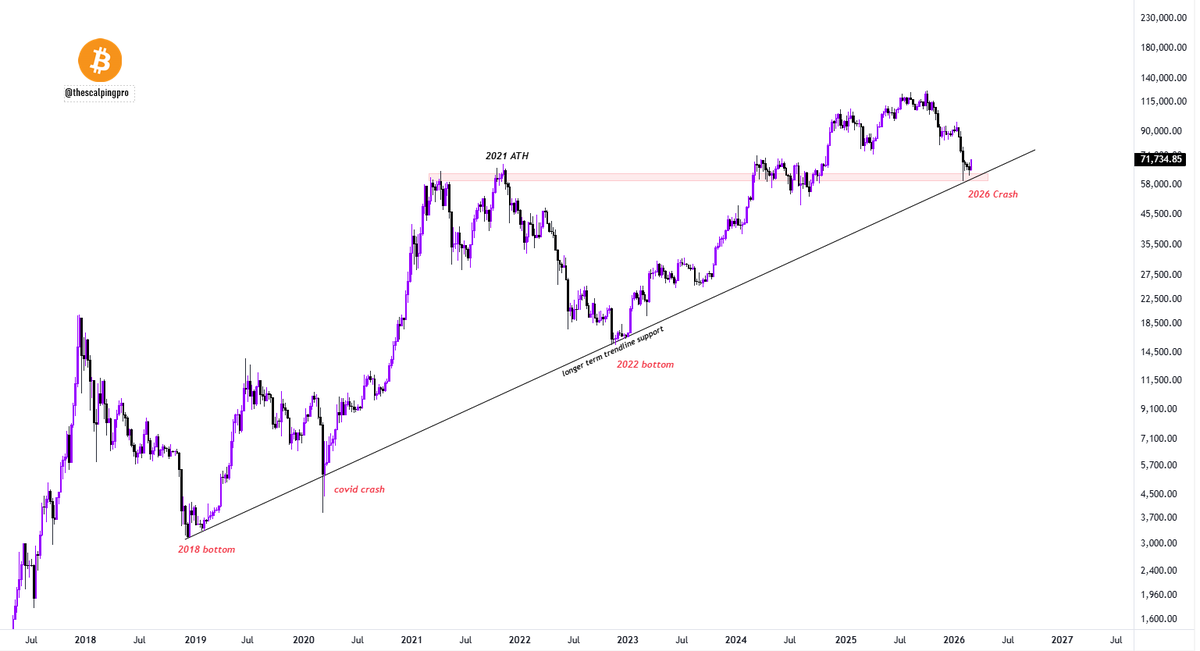
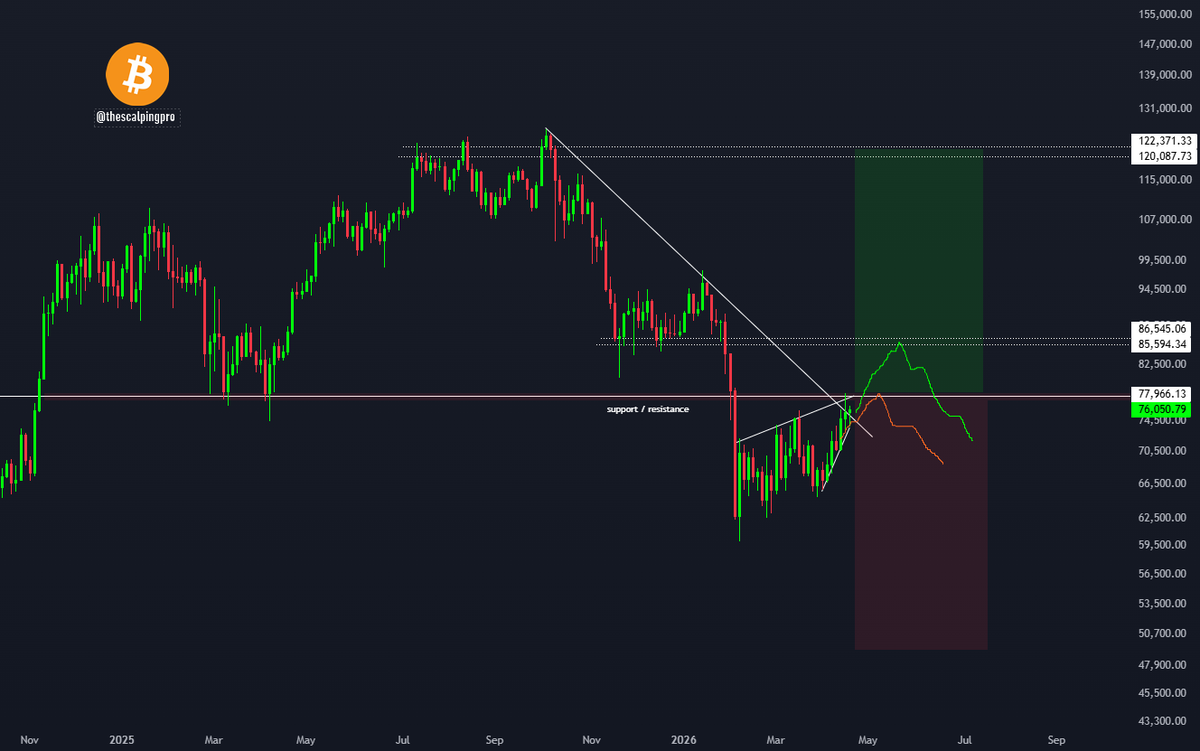
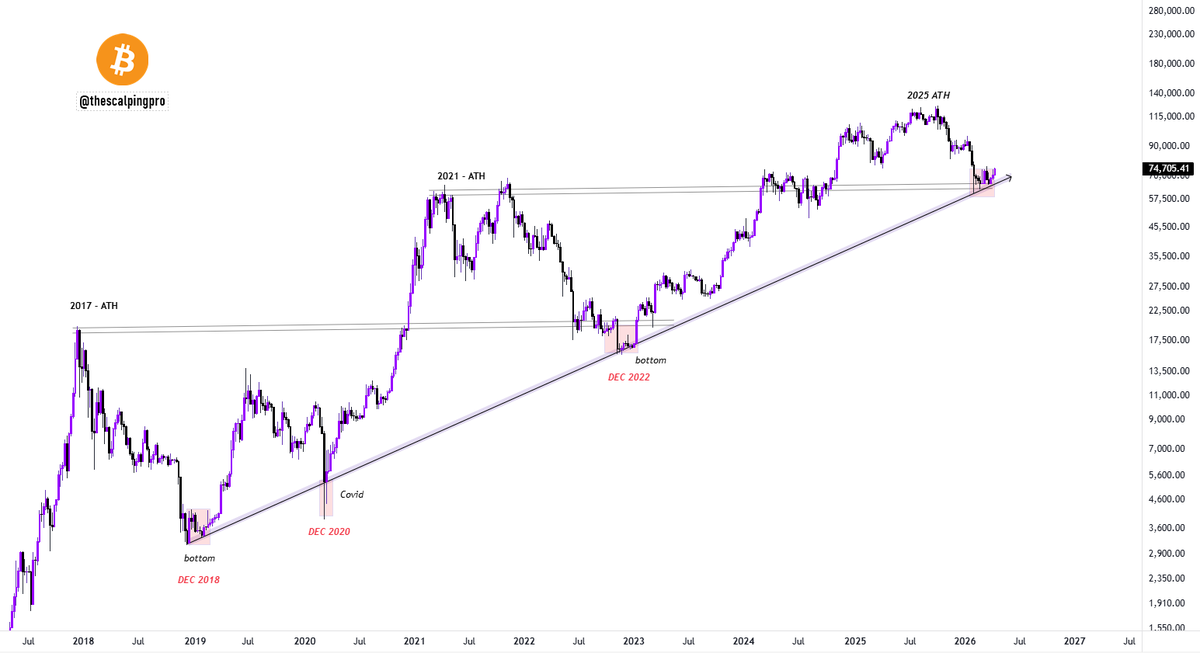
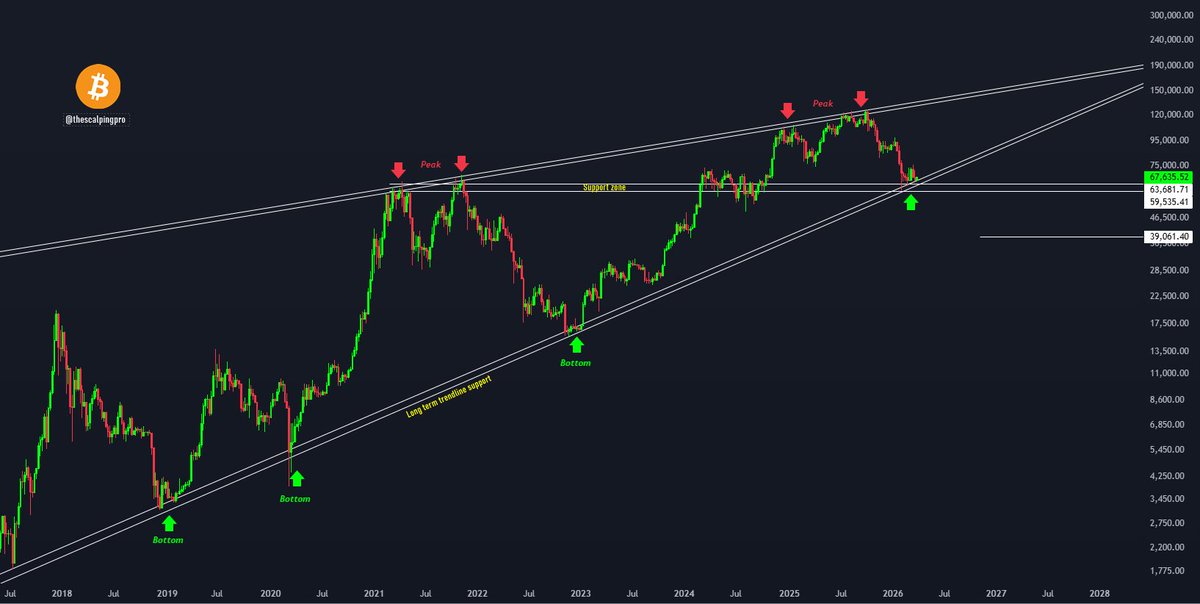
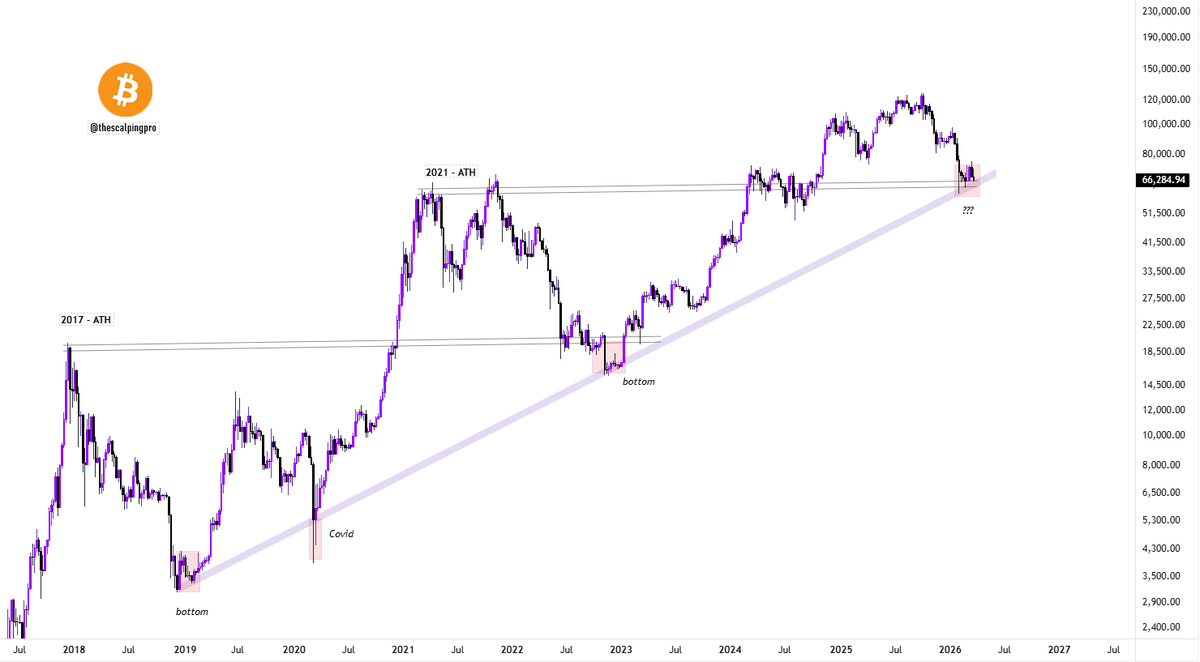
#Bitcoin is bouncing from the same long-term trendline that has marked every major low so far.
Right now, BTC is at :
• The multi-year upwards sloping trendline support
• The 2021 ATH horizontal support
This multi year trendline has held at:
– 2018 cycle bottom
– March 2020 covd crash
– 2022 bear market bottom
- 2026 Crash ??
Each time price has tested this trendline it has marked the bottom for Bitcoin.
Will this time be different? 🤔