


Price is only half the story in Bitcoin.
The other half is behavior. And onchain is where you see it.
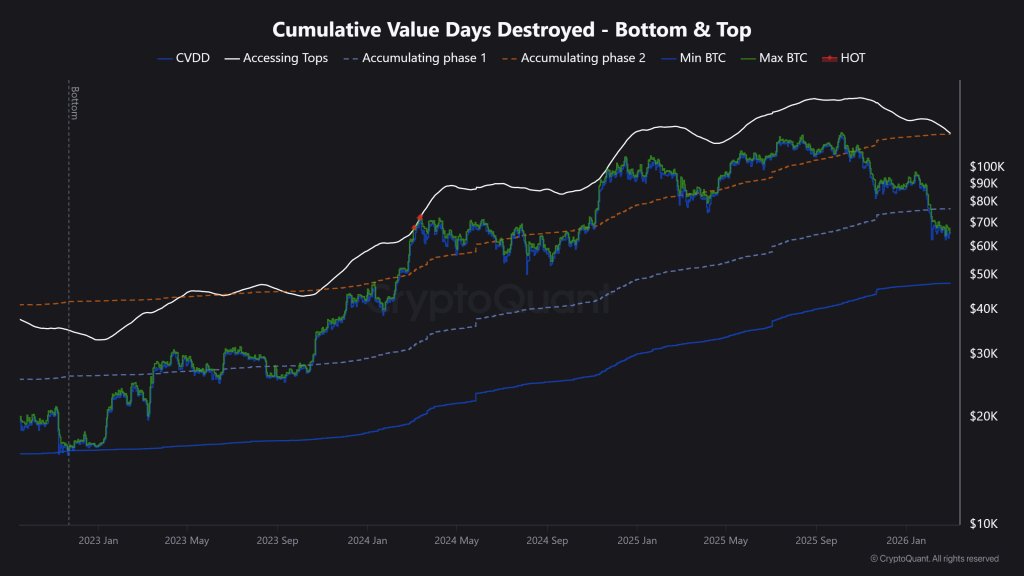
One metric I keep coming back to is CVDD.
It’s a simple way to track when long dormant BTC finally moves, and what that usually means for cycle bottoms.
Here’s the clean breakdown:
What CVDD Actually Measures
CVDD = Cumulative Value Days Destroyed.
Every BTC has an “age.”
When coins that haven’t moved in a long time finally move, a lot of “coin days” get destroyed.
So CVDD is basically a model built around one question:
When do long term holders stop sitting still, and when do they start accumulating again?
That’s why it’s useful.
It’s not trying to read short-term traders.
It’s trying to read the slow money.
How It Tends To Behave
Historically, CVDD has often lined up with “bottom zones” more than “bottom candles.”
Because most bottoms aren’t one magical wick.
Most bottoms are a process.
What Past Cycles Rhymed Like
You can look at older cycles and notice the same pattern showing up again and again:
➜ After a big unwind, price often drifts toward the CVDD zone
➜ It hangs around that area for a while
➜ Then the next cycle starts building from there
There are exceptions.
March 2020 was a liquidity shock. Price tagged the zone fast, then bounced fast.
But the more common version is slower:
Price comes down.
Price chops.
Price spends time.
Why The “Bottom Process” Takes Time
People love asking “Is this THE bottom?”
That’s usually the wrong question.
Bottoms often include:
➜ Weak hands getting shaken out
➜ Volatility cooling off
➜ Interest and hope bleeding out
➜ Long-term holders quietly stepping back in
➜ Price building a base while sentiment stays disgusting
That psychology does not resolve in a weekend.
Which is why CVDD is better used as a zone and time tool, not a single price tool.
Where CVDD Is Pointing Right Now
Right now, the CVDD reference level sits around $47.5K.
That does not mean “$47.5K is guaranteed bottom.”
It means:
If Bitcoin is still behaving like a cyclical asset, that area has historically been a meaningful region where the bottoming process can happen.
Could price wick below it? Sure. That’s happened before.
But the key thing most people miss is this:
The longer price spends building around a major reference zone, the healthier the base usually becomes.
Fast V-bounces feel good. Slow bases tend to be what cycles are built on.
How I Use It Practically
I don’t treat CVDD like a buy signal.
I treat it like a behavior filter.
When price is approaching CVDD, I’m watching:
➜ Does price spend time or just touch and bounce?
➜ Does volatility compress after the panic?
➜ Do long-term holder behaviors start stabilizing?
➜ Does sentiment stay ugly while structure improves?
That combination is usually where the real cycle setups form.
One Important Note ✍️
CVDD is not “the one metric.”
No onchain metric is.
But CVDD has earned respect because it’s tied to something real:
Long held coins finally moving. Long term conviction breaking or returning.
That’s a much cleaner signal than most narrative noise.
The Real Takeaway
The question isn’t “is $47.5K the bottom?”
it's “if the cycle structure is still intact, is this the zone where the bottom gets built?”
Because Bitcoin bottoms usually don’t print as one perfect candle.
They form the way sentiment breaks, then heals: price tests, chops, retests, spends time, and only then does the next leg become obvious in hindsight.
So im less focused on calling a number, and more focused on watching the process.
NFA.
From X
Disclaimer: The above content reflects only the author's opinion and does not represent any stance of CoinNX, nor does it constitute any investment advice related to CoinNX.