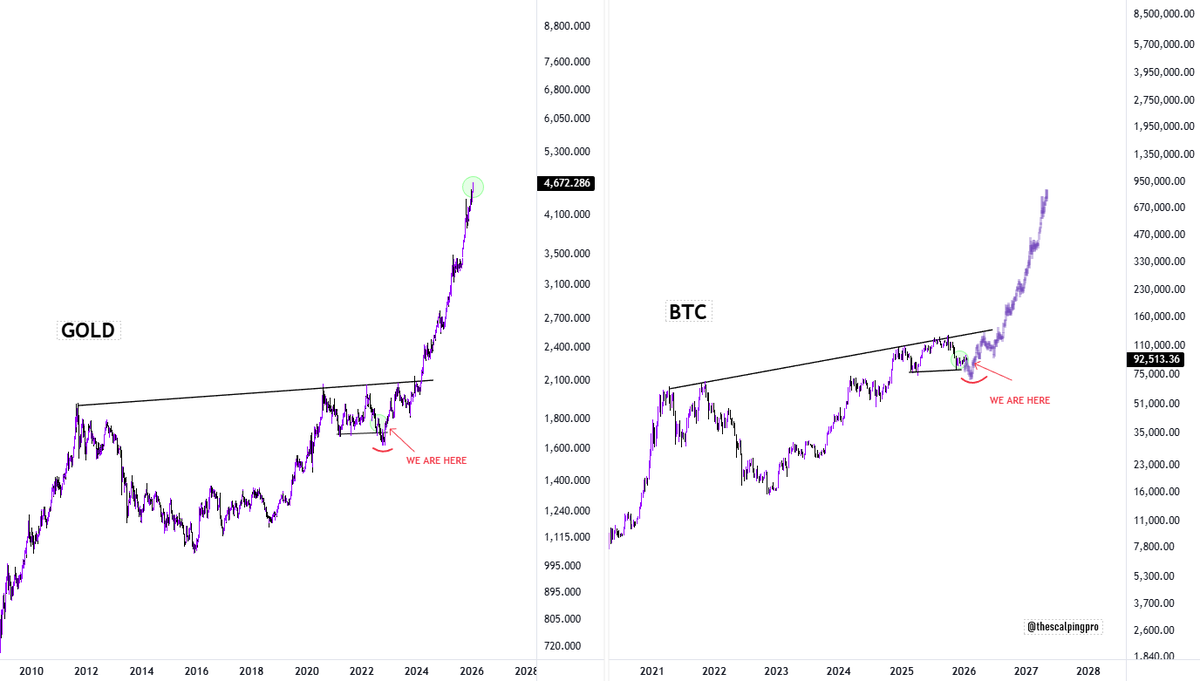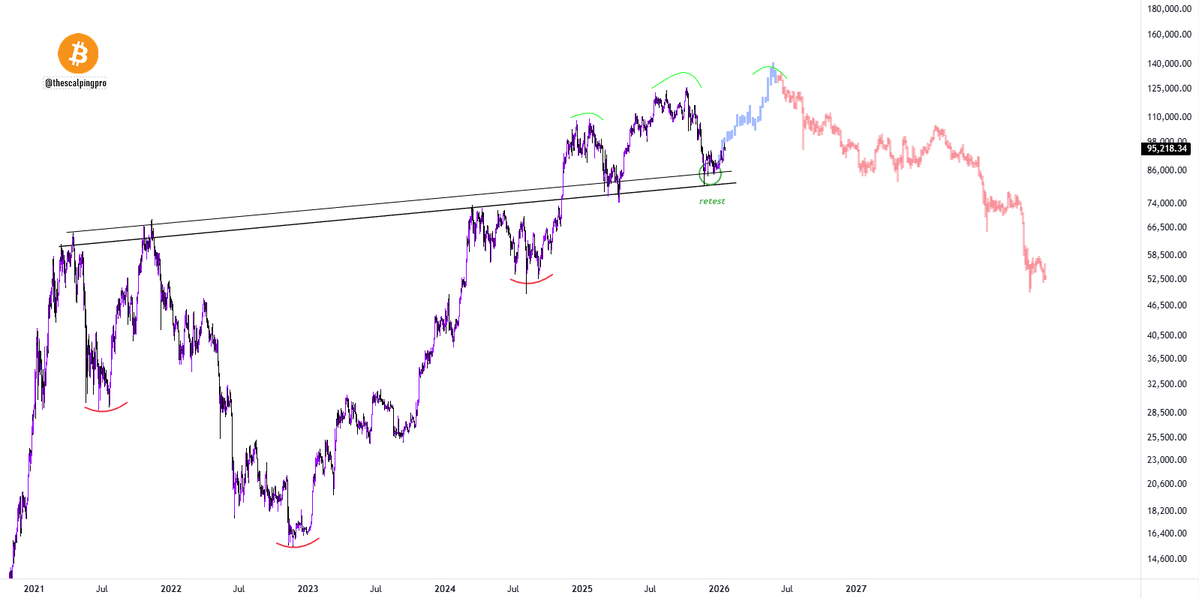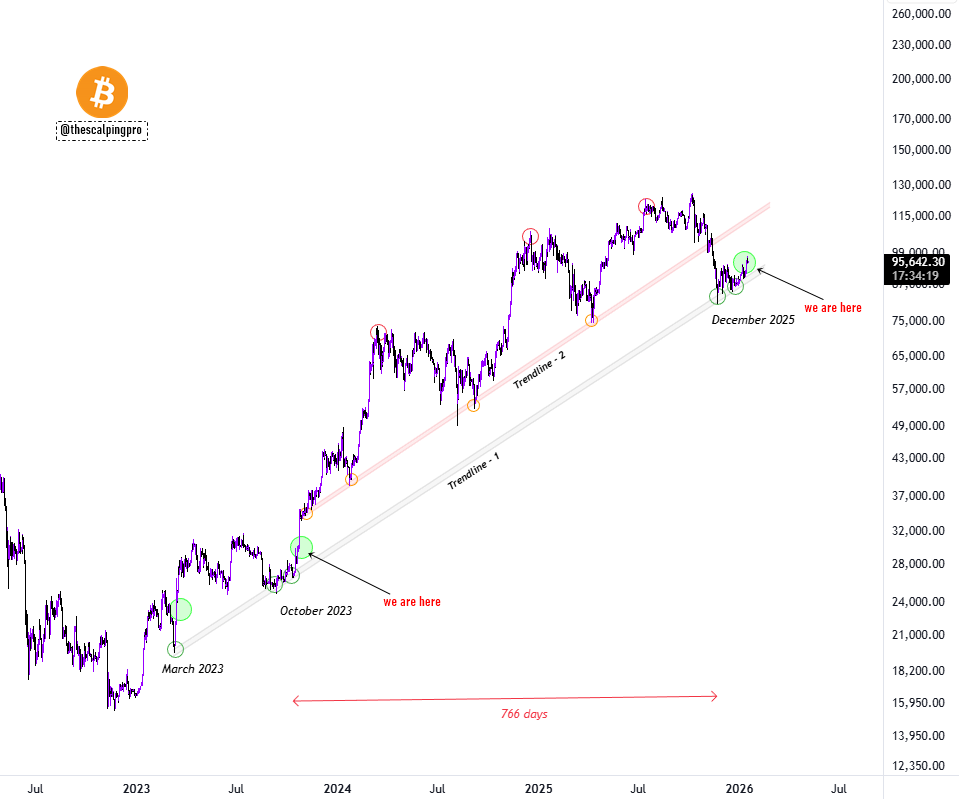


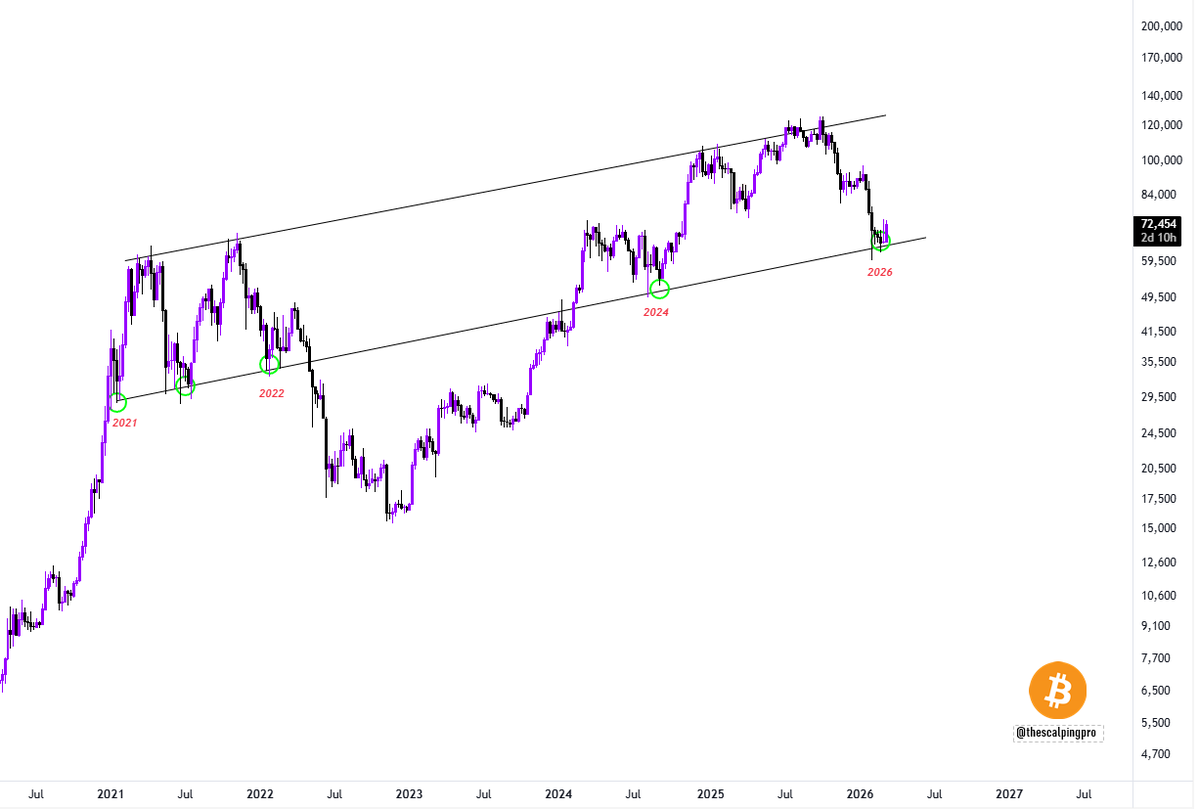


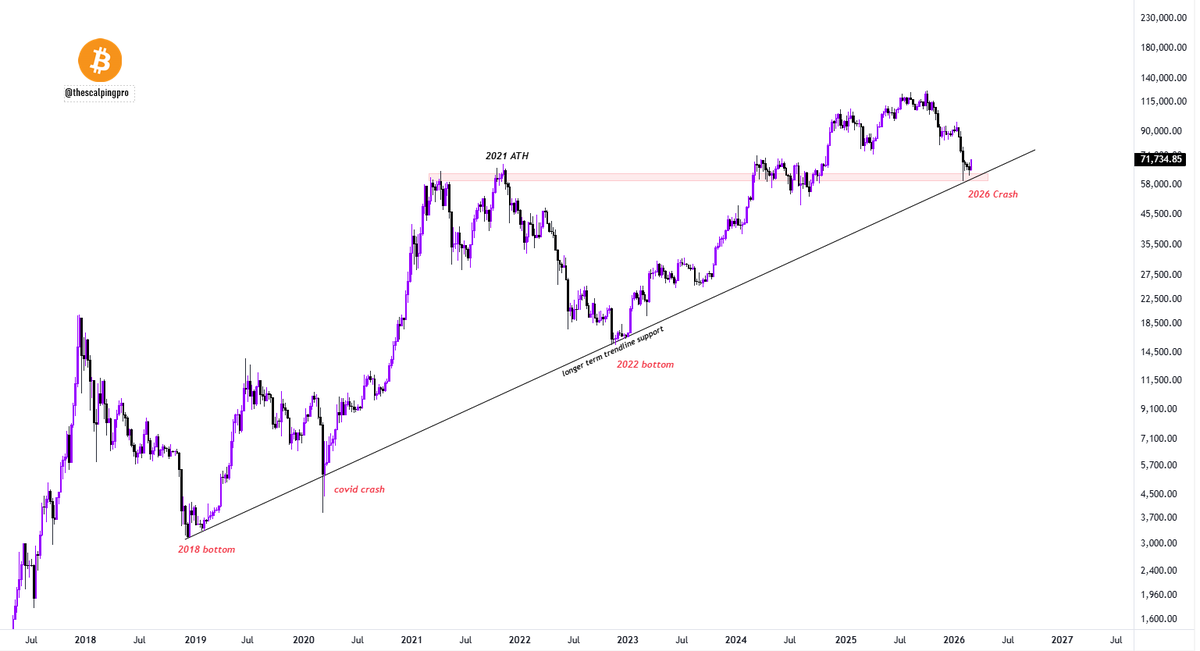
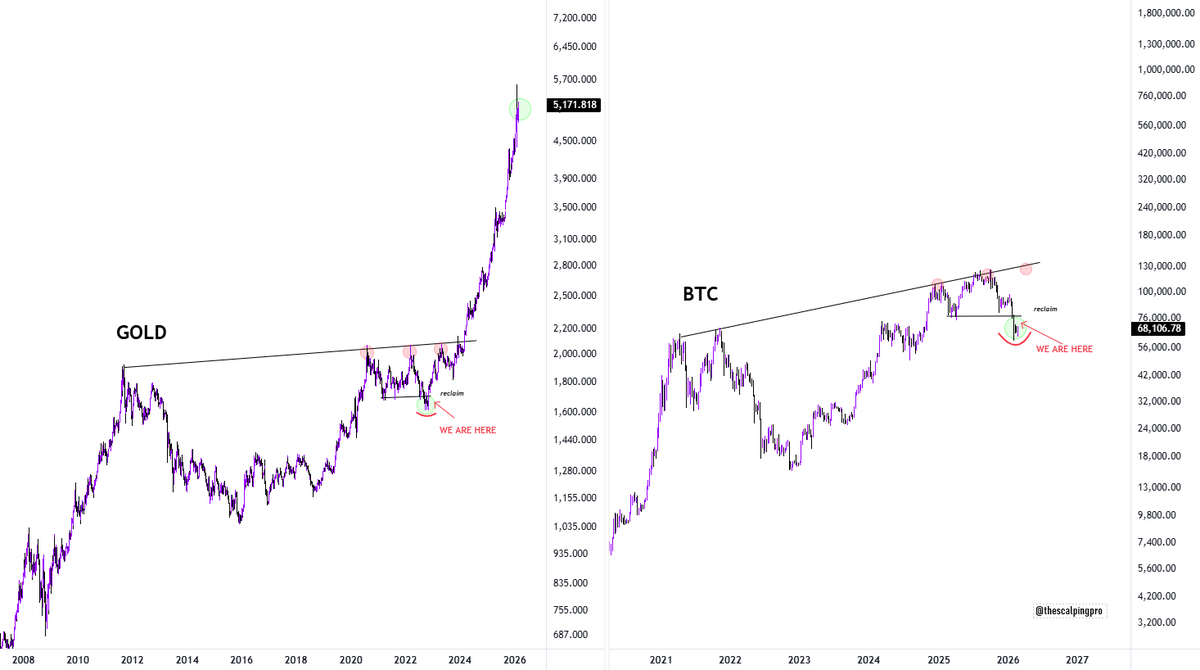
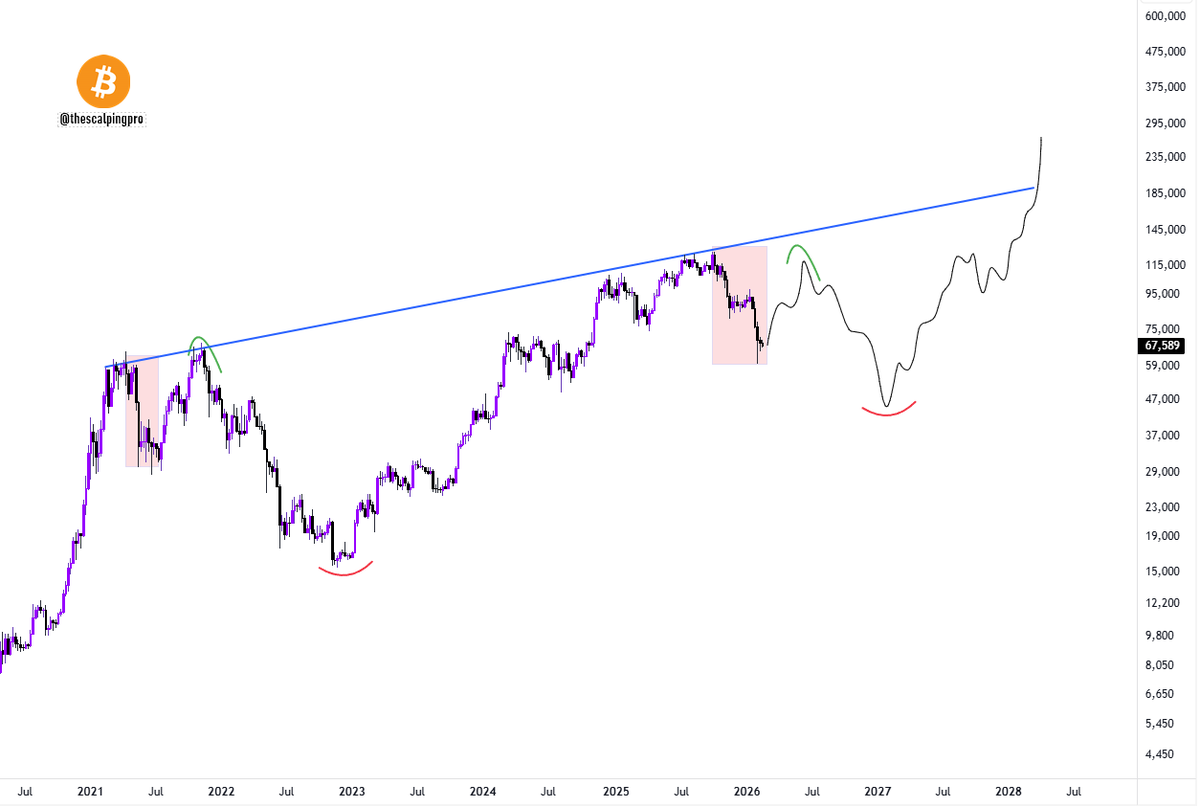
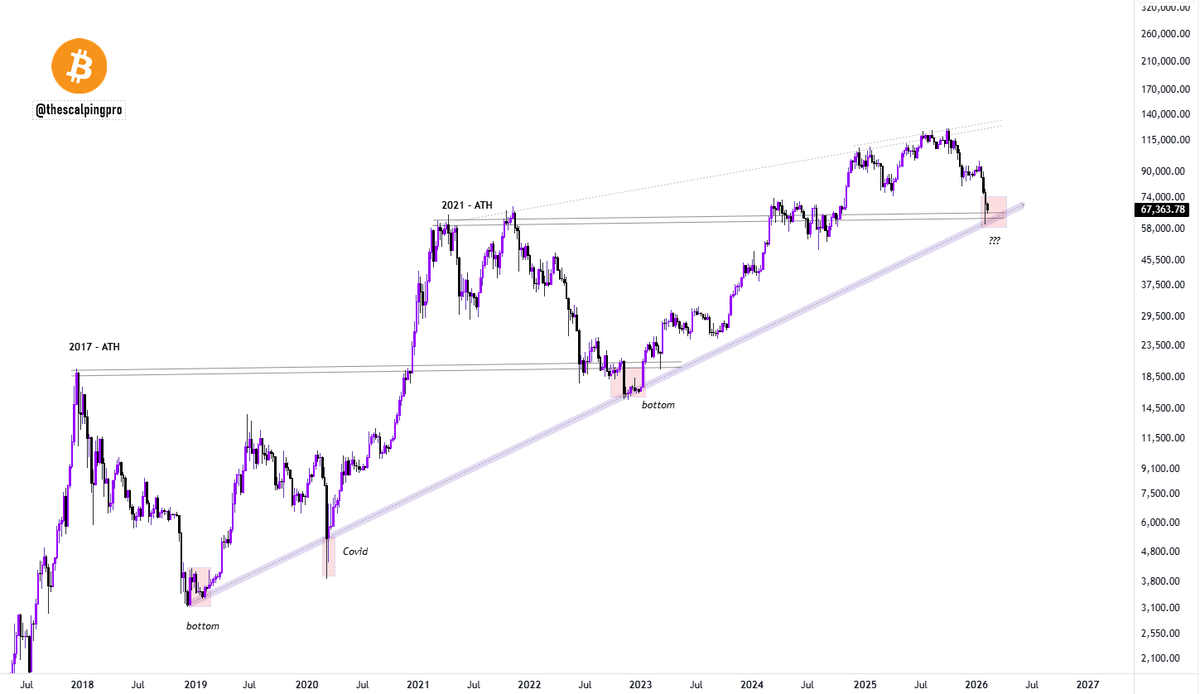
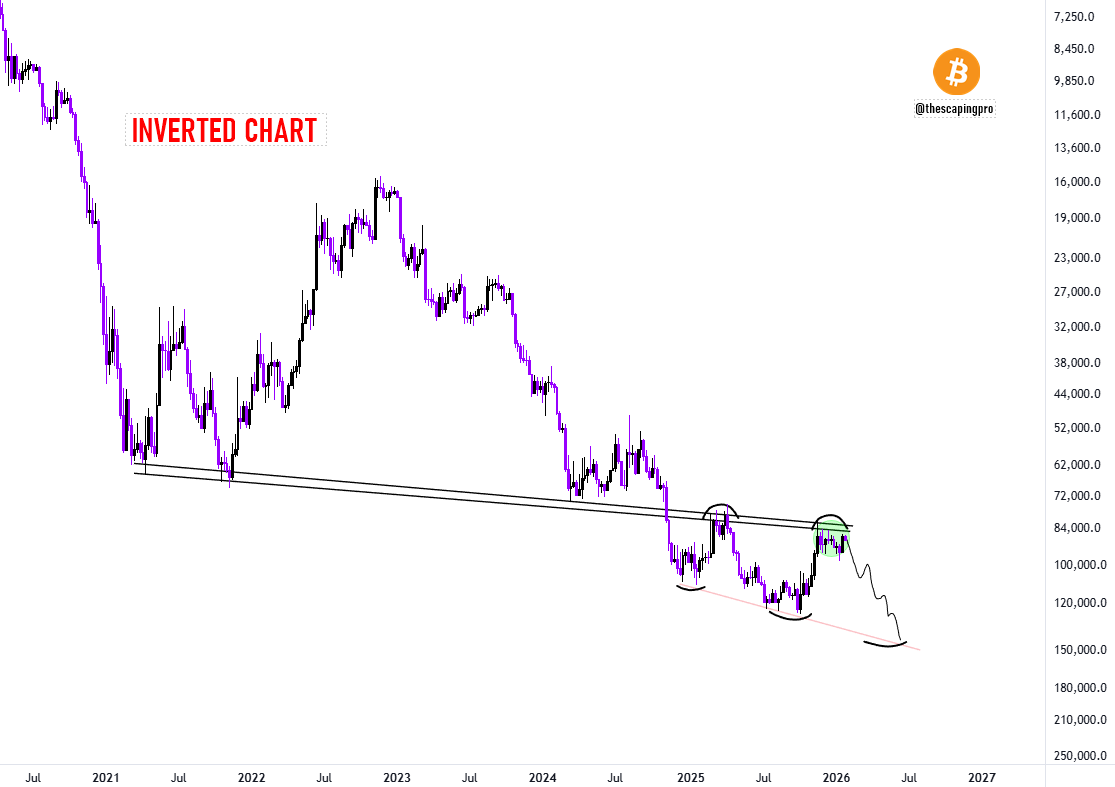
#Bitcoin is bouncing from the same long-term trendline that has marked every major low so far.
Right now, BTC is at :
• The multi-year upwards sloping trendline support
• The 2021 ATH horizontal support
This multi year trendline has held at:
– 2018 cycle bottom
– March 2020 covd crash
– 2022 bear market bottom
- 2026 Crash ??
Each time price has tested this trendline it has marked the bottom for Bitcoin.
Will this time be different? 🤔
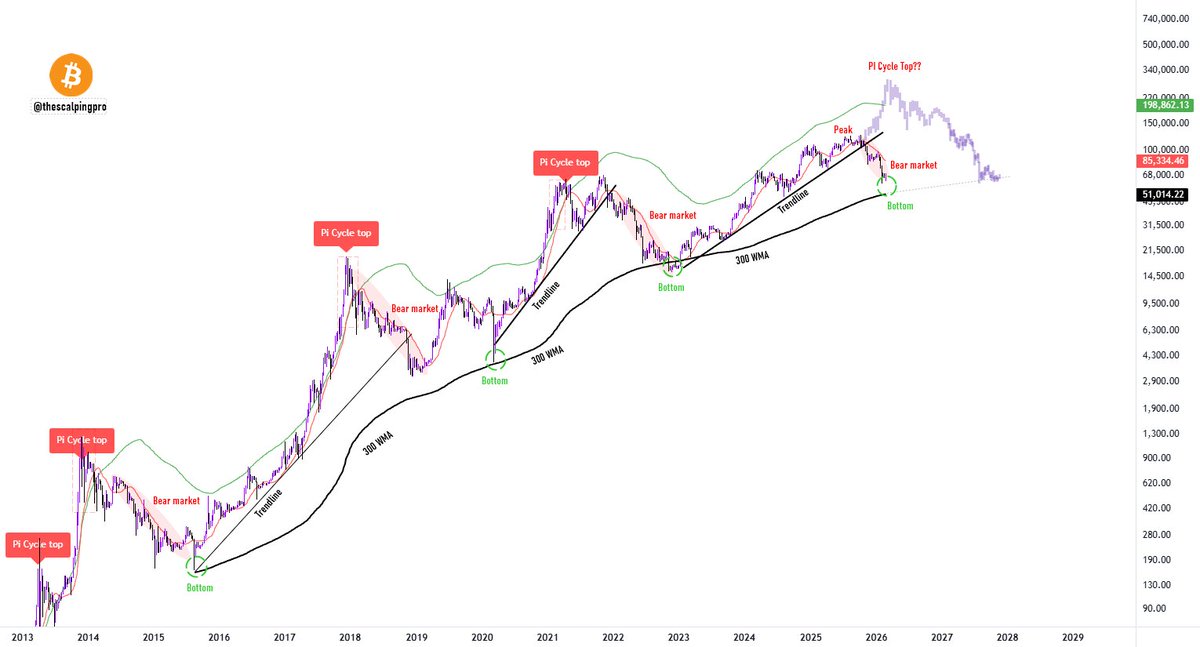
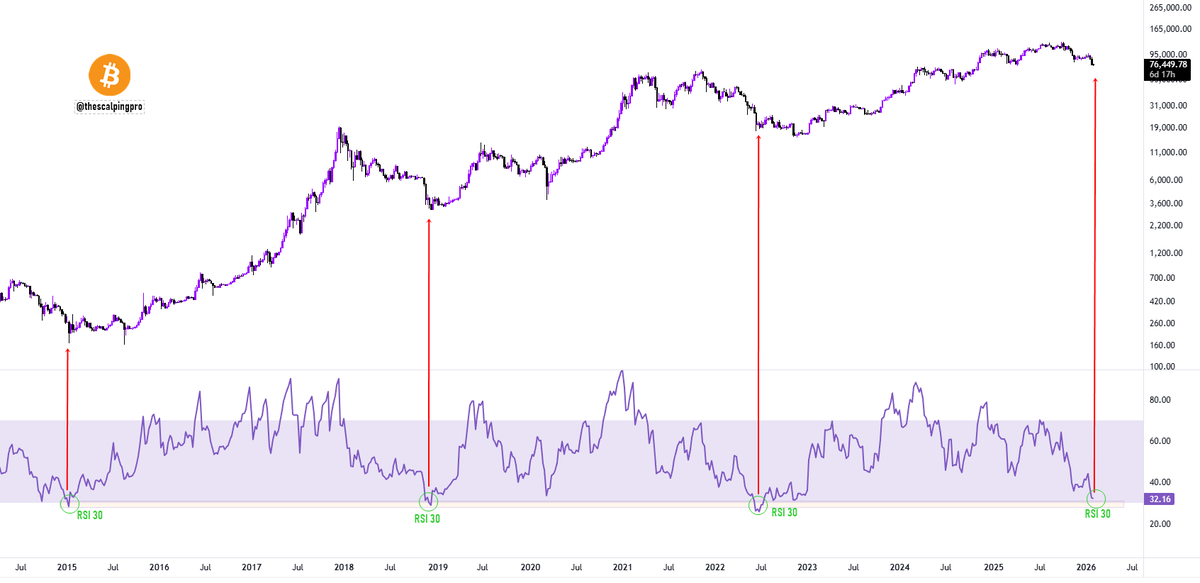
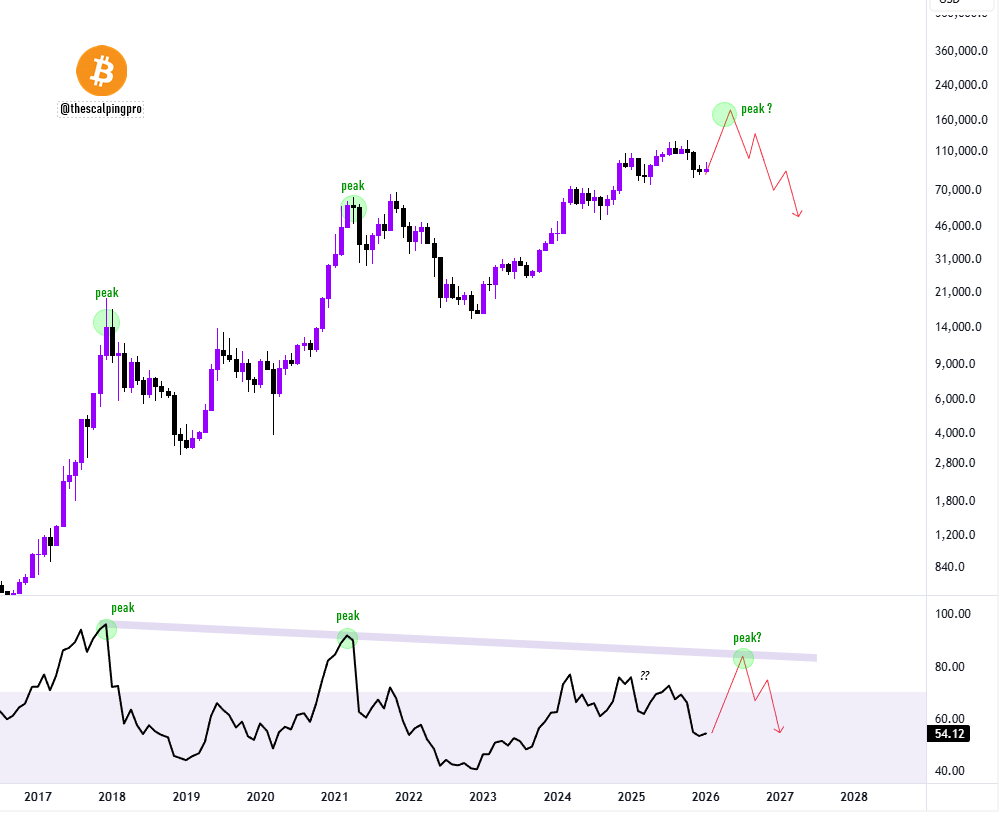
#Bitcoin - Did the Most Accurate Indicator Fail This Cycle?
The PI Cycle Top has been one of the most accurate indicators for predicting the Bitcoin cycle ATH.
In previous cycles, it marked the top almost perfectly.
But this time… it failed to do so.
The indicator prints a peak signal when the 111 DMA crosses above the 350 DMA ×2.
Historically, this crossover happens during rapid expansion phase, when Bitcoin goes parabolic and price starts trading well above the 350 DMA ×2.
Once the 111 DMA crosses above the 350 DMA ×2, it has consistently marked the cycle top and the beginning of the bear market.
However, in this cycle:
Price touched the 350 DMA x2 but never broke above it (green line).
The crossover never happend and the indicator never confirmed a proper peak signal.
Instead, Bitcoin broke below the long-term trendline support, catching many off guard.
For the first time, the “most accurate cycle peak” indicator didn’t behave the way it historically has.
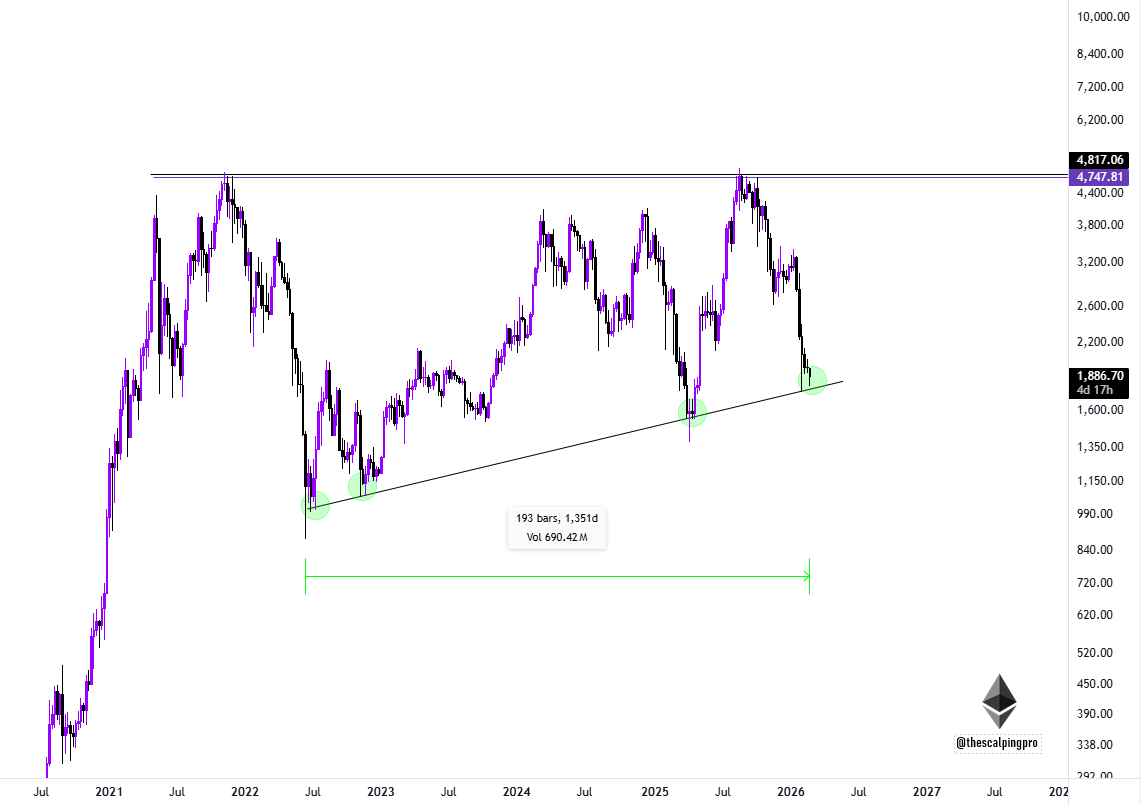
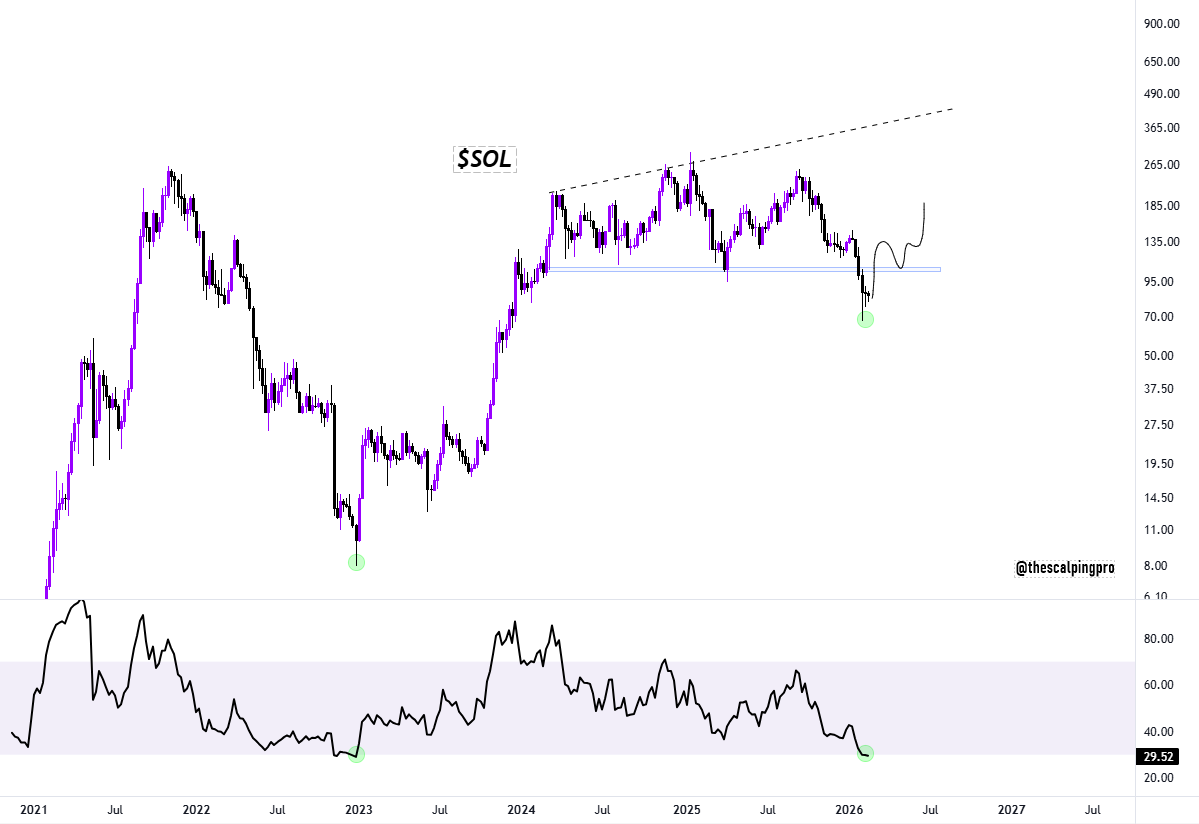
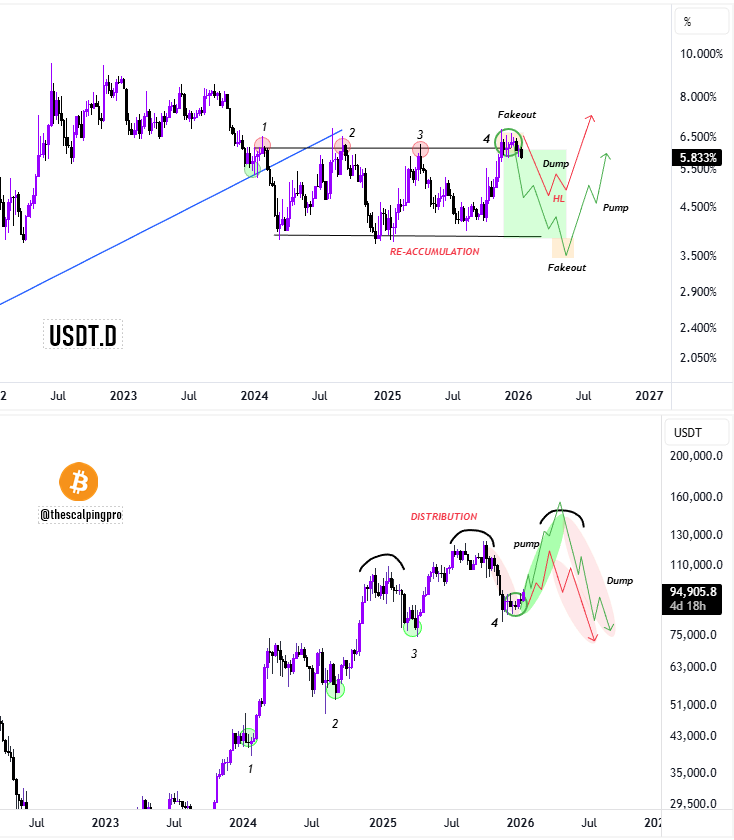
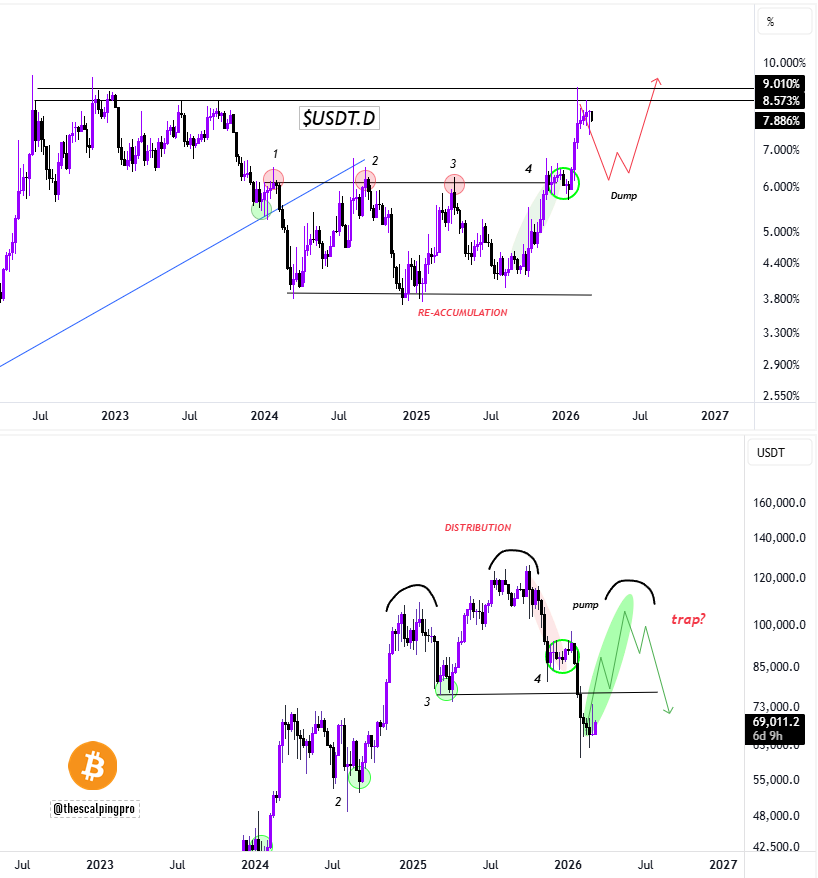
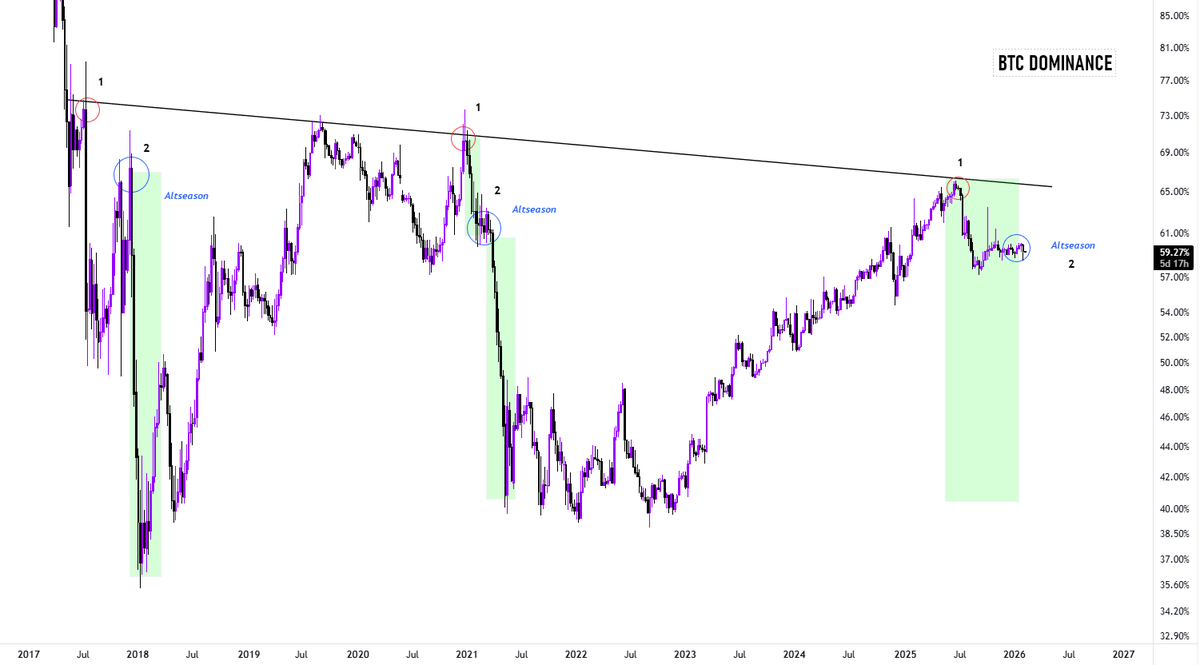
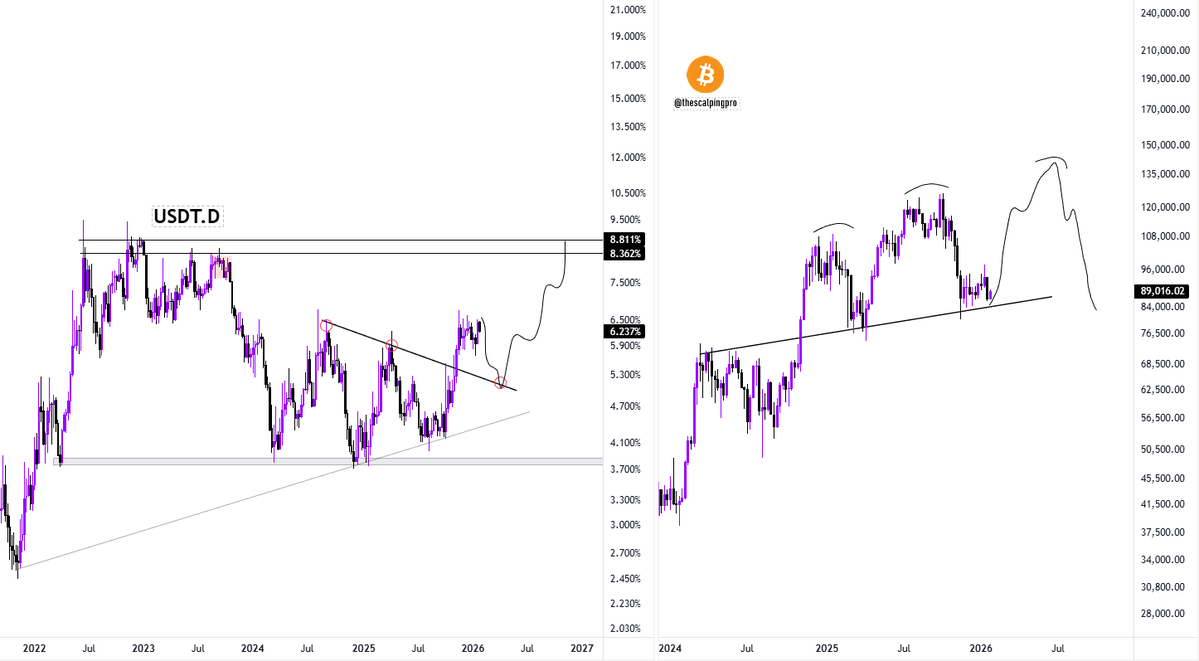
A Massive #Altcoin Season is loading ?🤔
This cycle hasn’t played out like the previous ones.
Altcoins underperformed badly - mainly because the total number of cryptocurrencies has exploded to 33M+ because of meme factories like pumpfun, causing massive dilution & VC unlocks have crushed price discovery.
Liquidity got spread thin instead of rotating cleanly.
Most altcoins are already deeply discounted.
And after the recent Bitcoin correction, even large-cap alts that were holding strong like BNB, ETH took a hit.
In each cycle after Bitcoin peaks, we have witnessed a massive drop in dominance and a final pump in altcoins.
We haven’t seen that so far in this cycle, but if you look closely, it appears dominance is forming a lower high before another leg down, similar to previous cycles.
Which means altcoins could pump in the short term, and can recover fast, this could be an opportunity to print.
A Massive #Altcoin Season is loading ?🤔
This cycle hasn’t played out like the previous ones.
Altcoins underperformed badly - mainly because the total number of cryptocurrencies has exploded to 33M+ because of meme factories like pumpfun, causing massive dilution & VC unlocks have crushed price discovery.
Liquidity got spread thin instead of rotating cleanly.
Most altcoins are already deeply discounted.
And after the recent Bitcoin correction, even large-cap alts that were holding strong like BNB, ETH took a hit.
In each cycle after Bitcoin peaks, we have witnessed a massive drop in dominance and a final pump in altcoins.
We haven’t seen that so far in this cycle, but if you look closely, it appears dominance is forming a lower high before another leg down, similar to previous cycles.
Which means an altcoin could pump in the short term, can recover fast and this could be an opportunity to print.

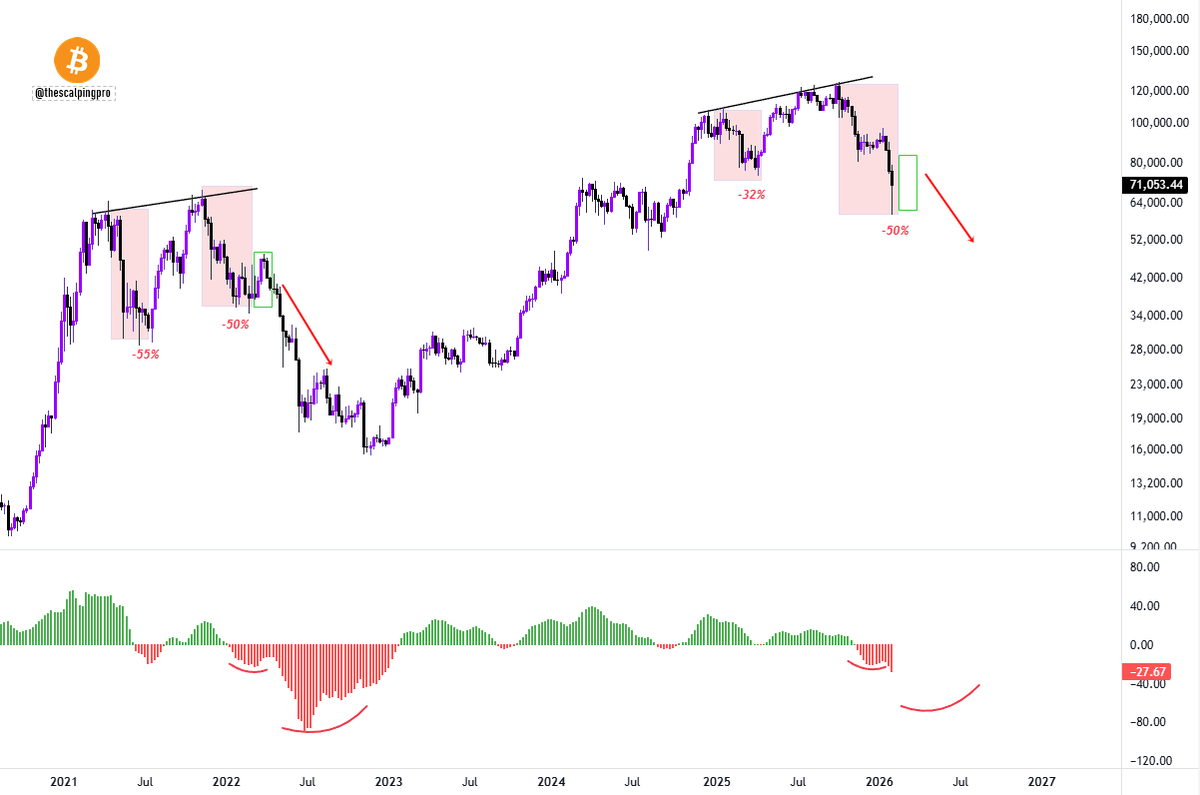
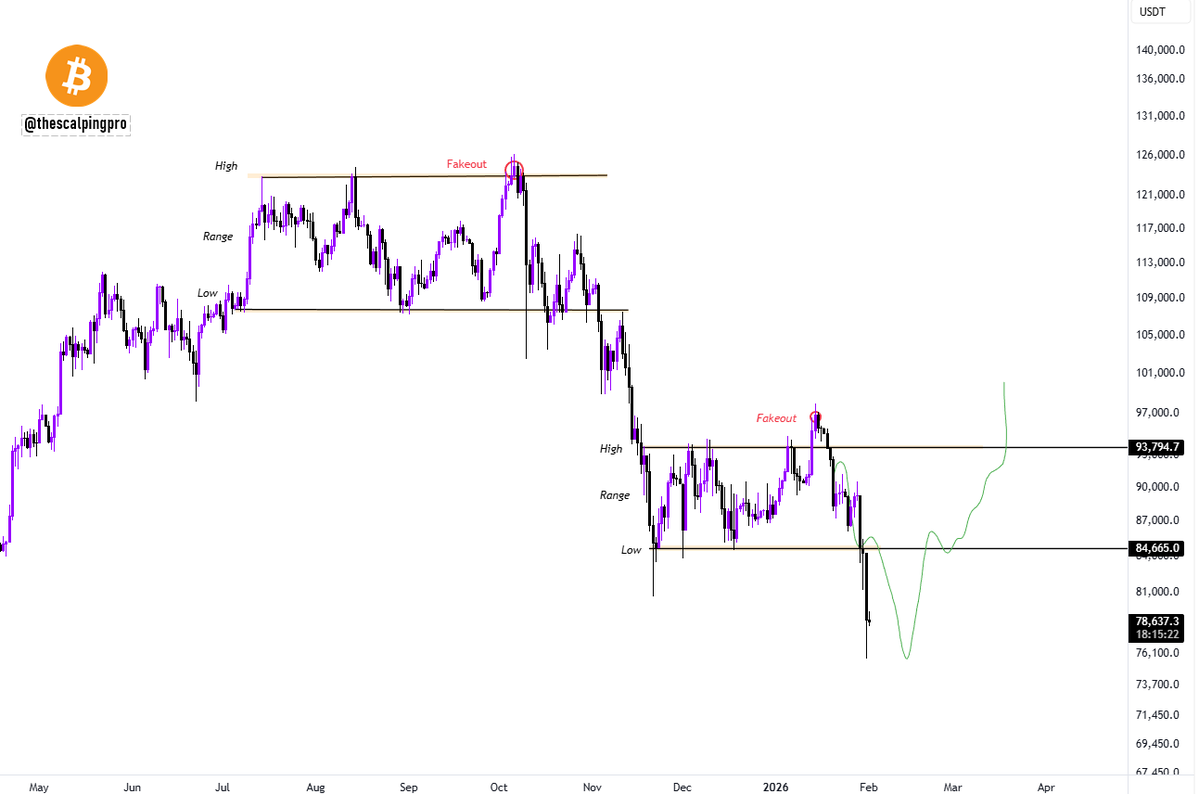


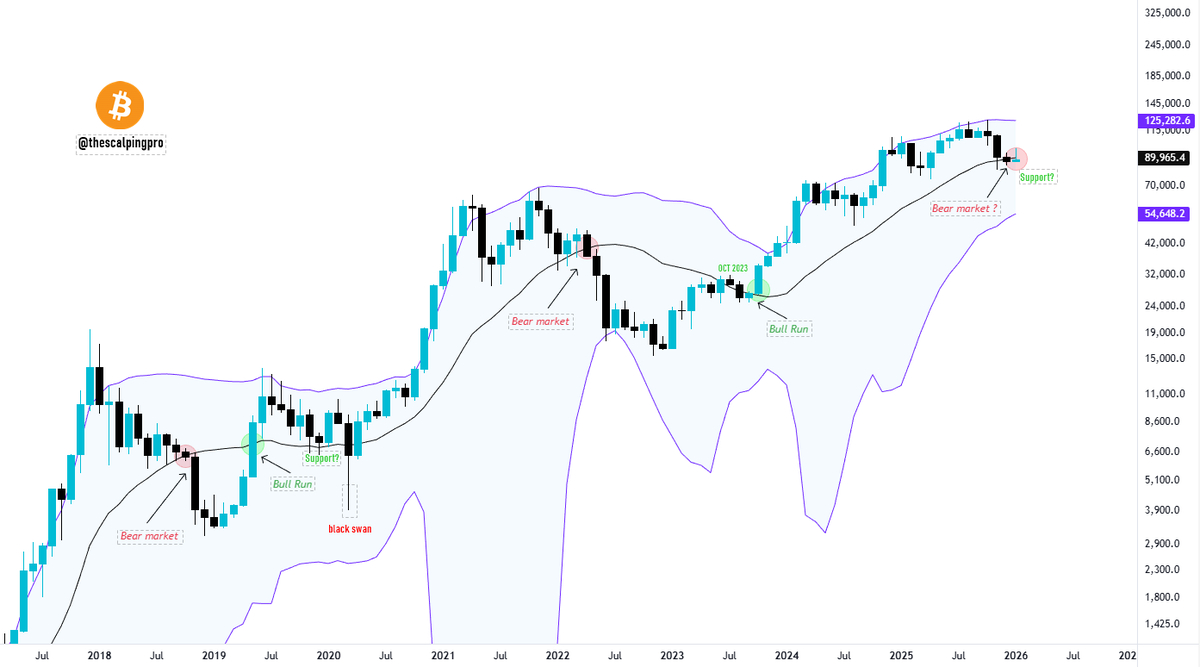
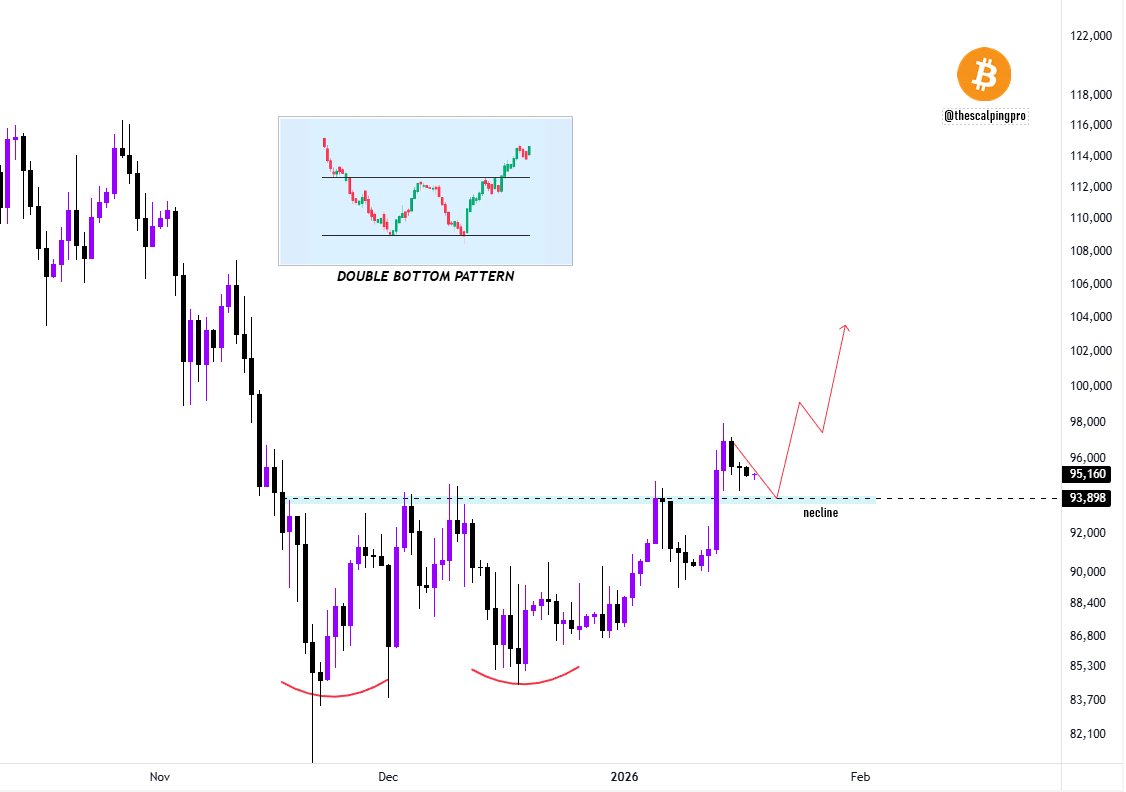
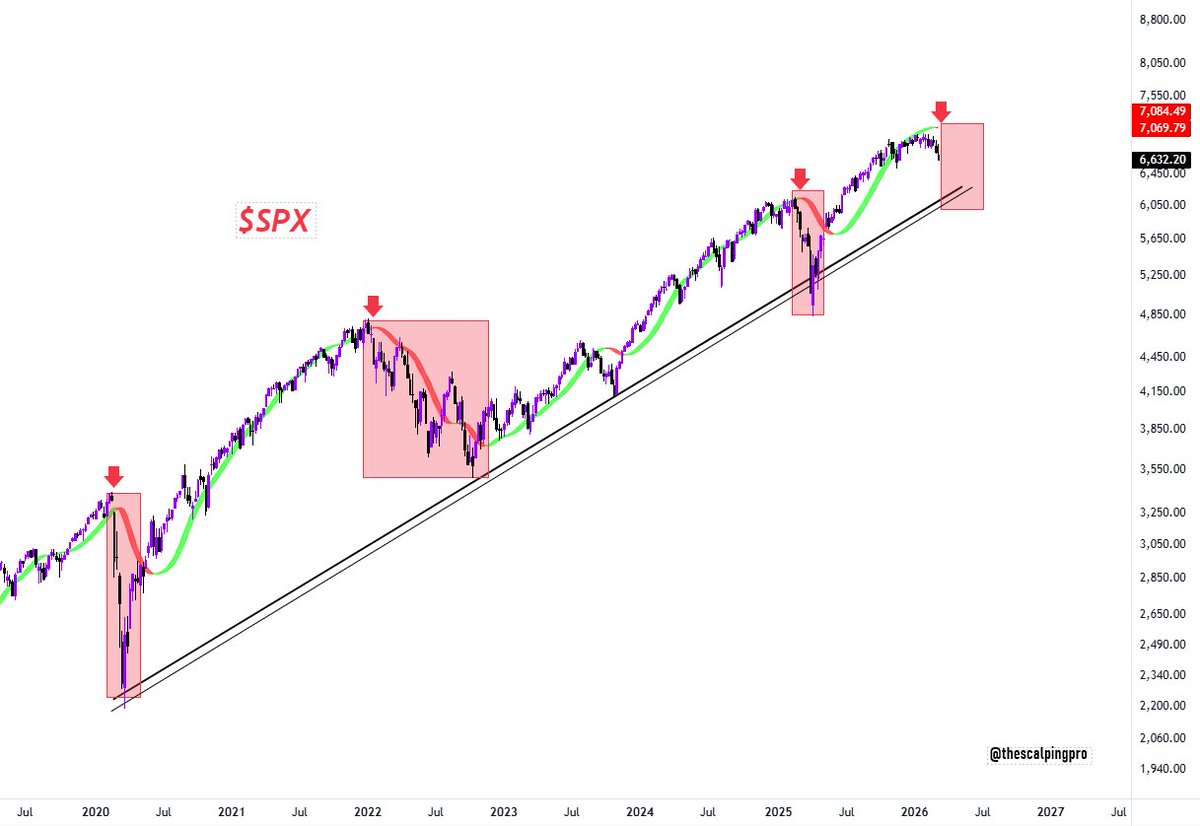
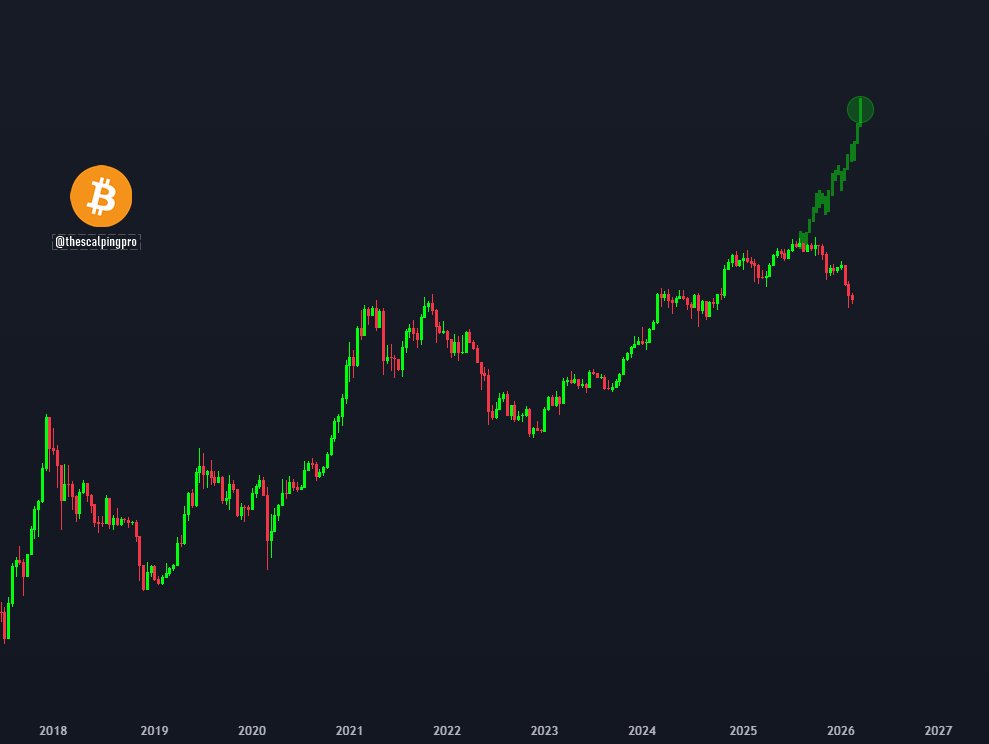
#Bitcoin is trading at a very crucial level🚨
Price is currently trading around the middle Bollinger Band.
Historically, when price breaks above the middle Bollinger Band, Bitcoin enters a strong bullish phase.
In this cycle, price reclaimed the mid band in October 2023 around $26,000, after which it rallied to $126,000.
So far, price has tested the middle Bollinger Band for the first time this cycle, which is a key support level.
A break below could trigger a massive correction and signal a bear market, while a successful hold could lead to a strong upside move.