


I wouldn’t ignore this.
There are rumblings that tomorrow’s ISM print comes in above 50, with some estimates even north of 51.
If that happens, it matters.
We’re lining up three signals:
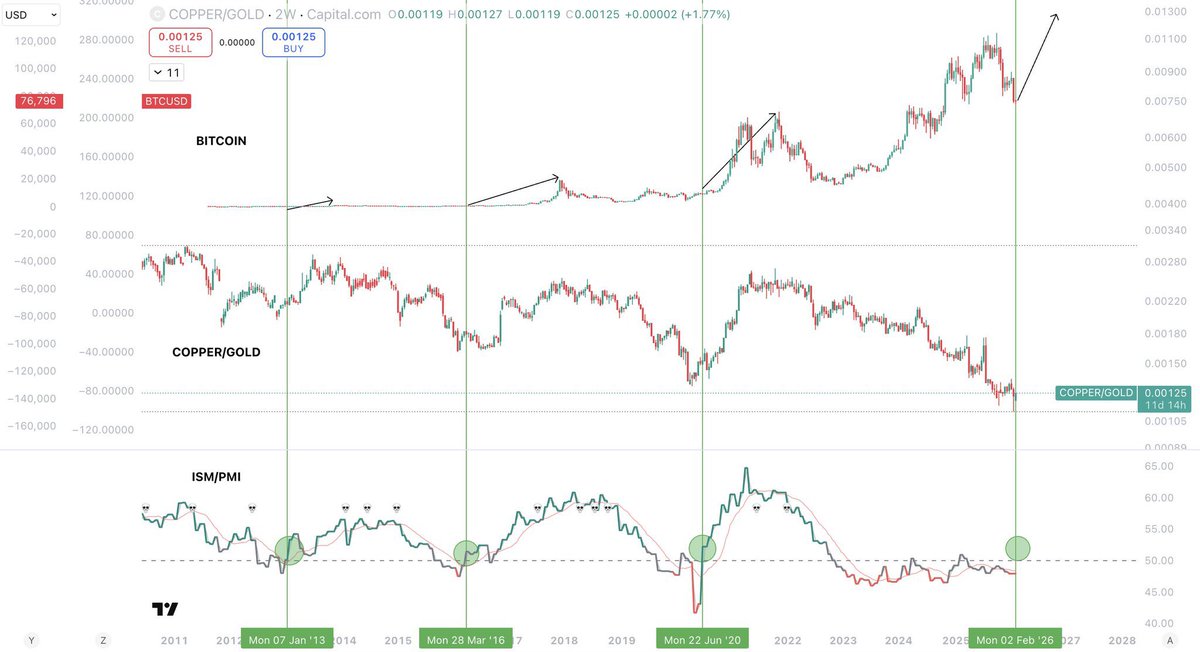
•Bitcoin
•Copper/Gold
•ISM and PMI
For anyone new to it: ISM is a manufacturing gauge that broadly signals contraction vs expansion. Below 50 = contraction. Above 50 = expansion.
And the relationship has been clean historically. Since Bitcoin’s inception, when ISM rebounds out of contraction and pushes back toward the low 50s, especially around the 52 area, it has tended to mark:
1.A bottom in Copper/Gold
2.The start of Bitcoin’s true expansion phase
What makes this cycle weird is PMI has been stuck in contraction for an unusually long time. That’s a big reason this bull phase has felt so different.
It’s also the first time Bitcoin has made new highs while PMI remains in contraction, which helps explain why the move has felt fragile. The macro and liquidity backdrop has not been fully supportive, so upside has struggled to sustain.
Now layer in the intermarket story. Gold looks like it may have exhausted its mega run. If that’s true, Copper/Gold is likely basing, with copper starting to lead as manufacturing and capex expectations improve, which feeds back into PMI.
At the same time, Bitcoin is pressing key higher time frame levels, right as sentiment has rolled over and most people have capitulated into the year long bear narrative.
Same message from different angles.
If PMI or ISM prints near 52 tomorrow, I’d expect it to be a real surprise to positioning and could kick off a reversal phase through February.
This is the kind of data that actually moves regimes.
From X
Disclaimer: The above content reflects only the author's opinion and does not represent any stance of CoinNX, nor does it constitute any investment advice related to CoinNX.