


A closer look to $SOIL chart reveals interesting moves...
➜ After a prolonged downtrend, the price seems to be finding support around the $0.77 level. A double bottom pattern appears to be forming.
📊 Furthermore, the volume is increasing on up moves and decreasing on down moves, suggesting buyers are gaining strength.
➜ MACD indicator is showing bullish divergence, with higher lows forming while the price makes lower lows.
📈 If the price breaks above the neckline of the double bottom pattern (around $0.83), it could trigger a significant rally, with the next target potentially being the previous high around $1.00.
➜ Plus, the integration with many chain like @avax and more will surely be a huge catalyst for the price action movement!
👀 Be sure to keep your eyes peeled on the chart to spot the confirmation!
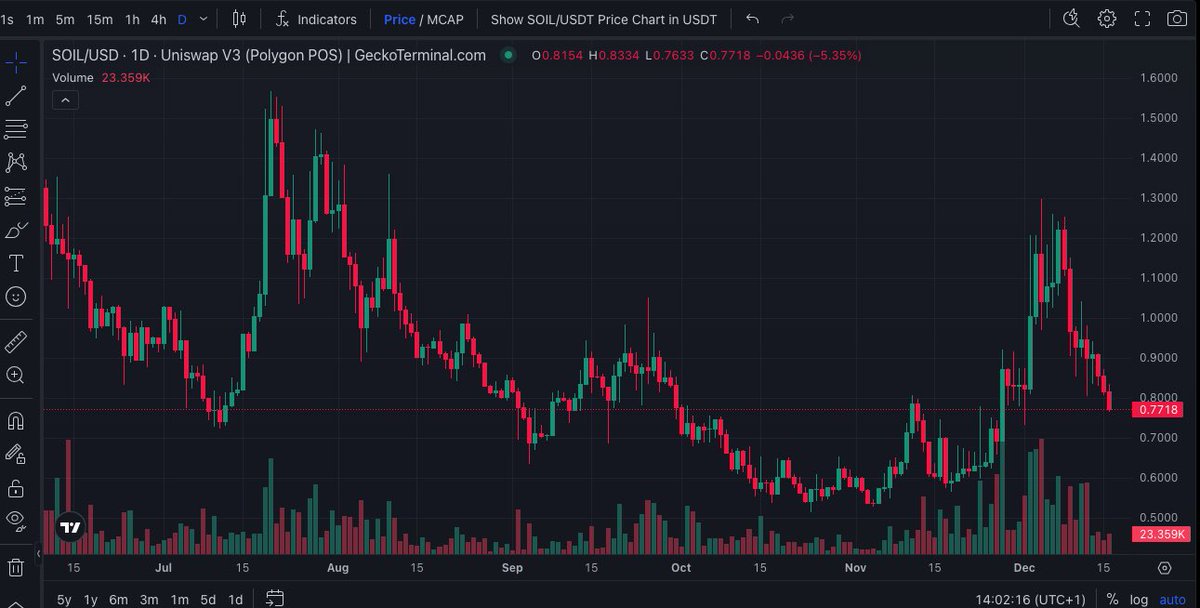
From X
Disclaimer: The above content reflects only the author's opinion and does not represent any stance of CoinNX, nor does it constitute any investment advice related to CoinNX.