


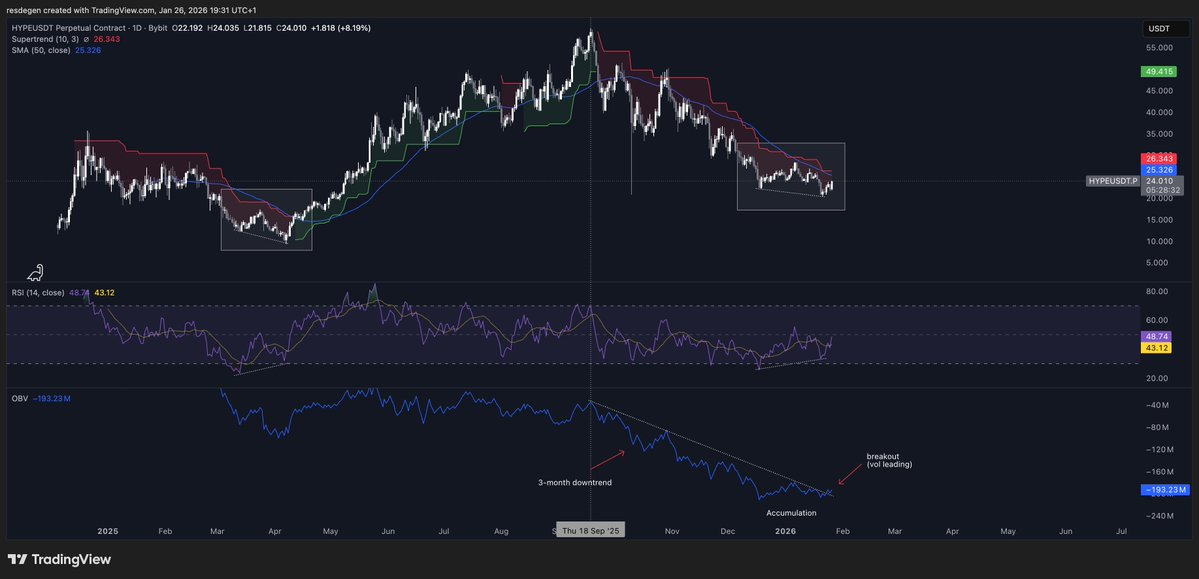
The chart supports @ericonomic’s thesis about selling pressure being absorbed.
• Very similar RSI conditions on oversold territory to March-April bottom, forming bullish divergence.
• Similar duration ≈ 4-month downtrend
• $10 vs. $20 rounded levels
• OBV stopped downtrend, is currently accumulating and leading with a potential breakout
OBV (On Balance Volume) measures whether volume is flowing into or out of an asset, or supporting or diverging from price, and tends to be a leading indicator.
While price made a new lower low, OBV shows absorption and re-accumulation and is attempting to breakout here.
Next, we will see price flip the daily MA and Supertrend for further confirmation.
All of this with the support of improved fundamentals, specifically around HIP-3 markets making new records in volume and OI (another clear divergence).

From X
Disclaimer: The above content reflects only the author's opinion and does not represent any stance of CoinNX, nor does it constitute any investment advice related to CoinNX.